Hey there, I’ve been recently using a QA403 to do some audio testing. I was having trouble with some frequency response stuff (which I’ve since figured out), but I stumbled upon some weirdness with the waveforms showing in the analyzer software.
Around 10Khz, the waveform starts to alias or something. It gets more and more pronounced the higher frequency you go (and also, the lower you have your sample rate). It makes sense that the sample rate has to be set high enough that the frequency you are looking at shows up, but even set to 192k, a 20kHz sine wave looks pretty jagged. FFT size doesn’t seem to affect it.
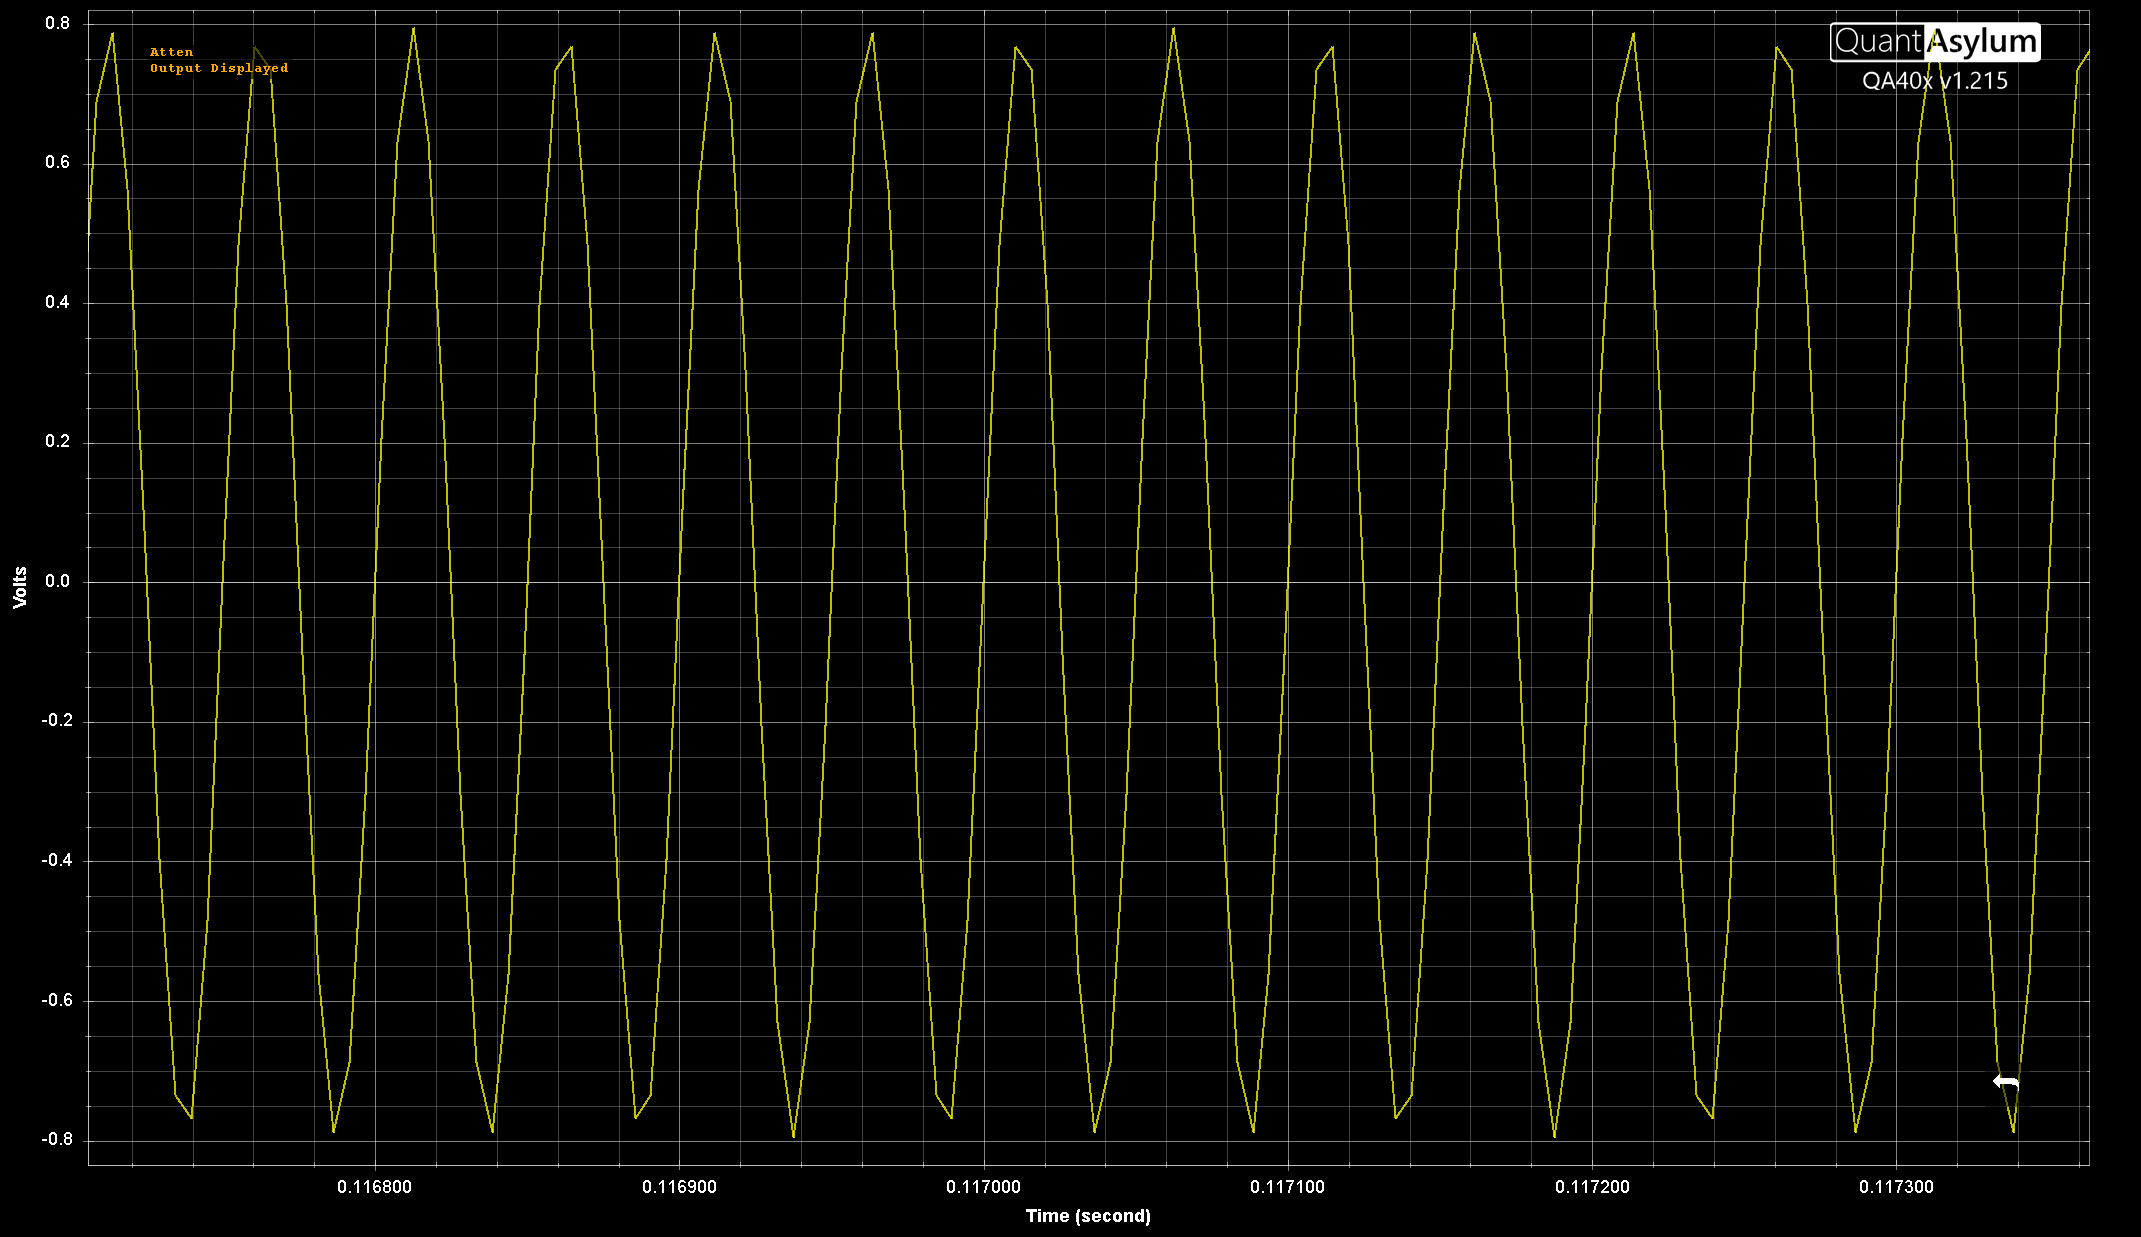
I looked at the output of the analyzer with a Rigol oscilloscope and the sine wave looks pretty clean to me, but the software seems like it won’t display it properly. I’ve set it to show the output directly and I’ve also looped back to an input to read it and both show the same thing. Any ideas?
Hi @matta yes, as @MarkT notes, that’s what the the raw points look like. At a 48khz sample rate, there are just 2.52 points to represent a 19 khz waveform. At 192k, there are 9.6 points to represent a 20 khz sine wave.
Thanks matt, I see. I think I’m still missing something here; are the generators separate from the output DAC? The manual states the ADC and DAC run at the same sample rate, but even at 48k the sine wave looks pretty perfect when measuring with a separate scope. I guess there’s some kind of interpolation happening before the wave is actually output, so maybe my question is more why the gui would show the raw points as opposed to the wave that will actually be output. Sorry, there’s probably something obvious I’m missing…
Sigma-delta converters typically behave like they have high quality reconstruction filters, although they are more complex than a simple DAC and filter.
The reconstruction filter is what is used to prevent aliasing in the output of a DAC, sigma delta DACs get this effectively for free, and get noise-shaping as well (which can look like noise on a ‘scope).
Yes, that is the magic of Nyquist! If you take an R2R DAC (that is, a DAC that has no inherent notion of bandwidth) and ask it to play back a 22 kHz sine sampled at 48k, you have just over 2 points per cycle, and the output will look like a lousy saw tooth on a scope (one high point and one low point). But if you take that saw tooth and push it through a brickwall low-pass filter with a corner at Nyquist (24 kHz) then the lousy sawtooth morphs into a pristine sine. That brickwall filter is commonly called the “reconstruction filter” that @MarkT referenced.
What gets displayed is a matter of preference. Most audio software I use does not just shows the jagged sine near Nyquist. The assumption is if you are working near Nyquist things will look funny BUT you can assume the output filter will clean all that up. And DSP software will never clean things up for you. It will show you the raw sample points.