hi there,
So I’m onto using the QA402 to make some intermodulation distortion measurement following the method posted on the website where I am trying to use the markers in order to get the amplitude of the peaks of the sidebands on my signal ! I’m however unlucky every time and cannot get a marker on any of the sideband peaks to show up (I can put a marker on the fundamental and any other more significant peak than the sidebands tough…) The cursors seem to work following the amplitude of the peaks but there is only two available and one of the unit on my benchmark shows about 5 peaks each side of the fundamental so I was wondering if there would be a way around that ??
Cheers,
Noe
Hi @noeh! When you click on a peak, a search is made +/- 0.25 octaves to find the nearest peak. That is probably too broad. Are you looking at +/-60 Hz products off of 7 kHz, for example? Probably the search width should be a function of the displayed X axis. So, you zoom in, drop a marker on the signal and then zoom back out, and the marker stays.
Let me know if SMTPE IMD is your scenario and we can address. Thanks!
I for one am interested in the SMTPE tone and I also had problems grabbing the sidebands. I was running ver 1.0 and the “peak” would ignore the 6940/7060 sidebands and would grab a more defined peak elsewhere on the FFT. I added a user filter to get rid of everything below 6000hz and above 8000hz and zoomed in to make the sidebands more defined and the obvious peaks but it wouldn’t auto find it.
I am 100% new to the whole workflow for the QA 402 and this was three weeks ago and I didn’t spend a lot of time on it but will gladly revisit it.
dave
Hi both,
Yeah I should have mentioned I’m trying to get SMPTE IMD! Here’s a screenshot of the analyser where I can’t grab the peaks !
cheers !
edit: I did try to zoom in as much as I could on the first sideband to the left with no success…

Hi @noeh, thanks very much for reporting this important use case, this has been fixed for the next release due out in the coming week or two.
Hi @matt, thanks for the prompt reply ! 
Since there’s a new release coming out soon I thought I might point this other potential bug to you !
When trying to plot the THD Vs input and:or output level of the same DUT I can get a good result graph when plotting againt the DUT input (Analyser Output) as shown in the image below:

but when using the exact same settings but trying to plot againt the DUT output level (analyser input) here is what I get with the exact same test conditions:
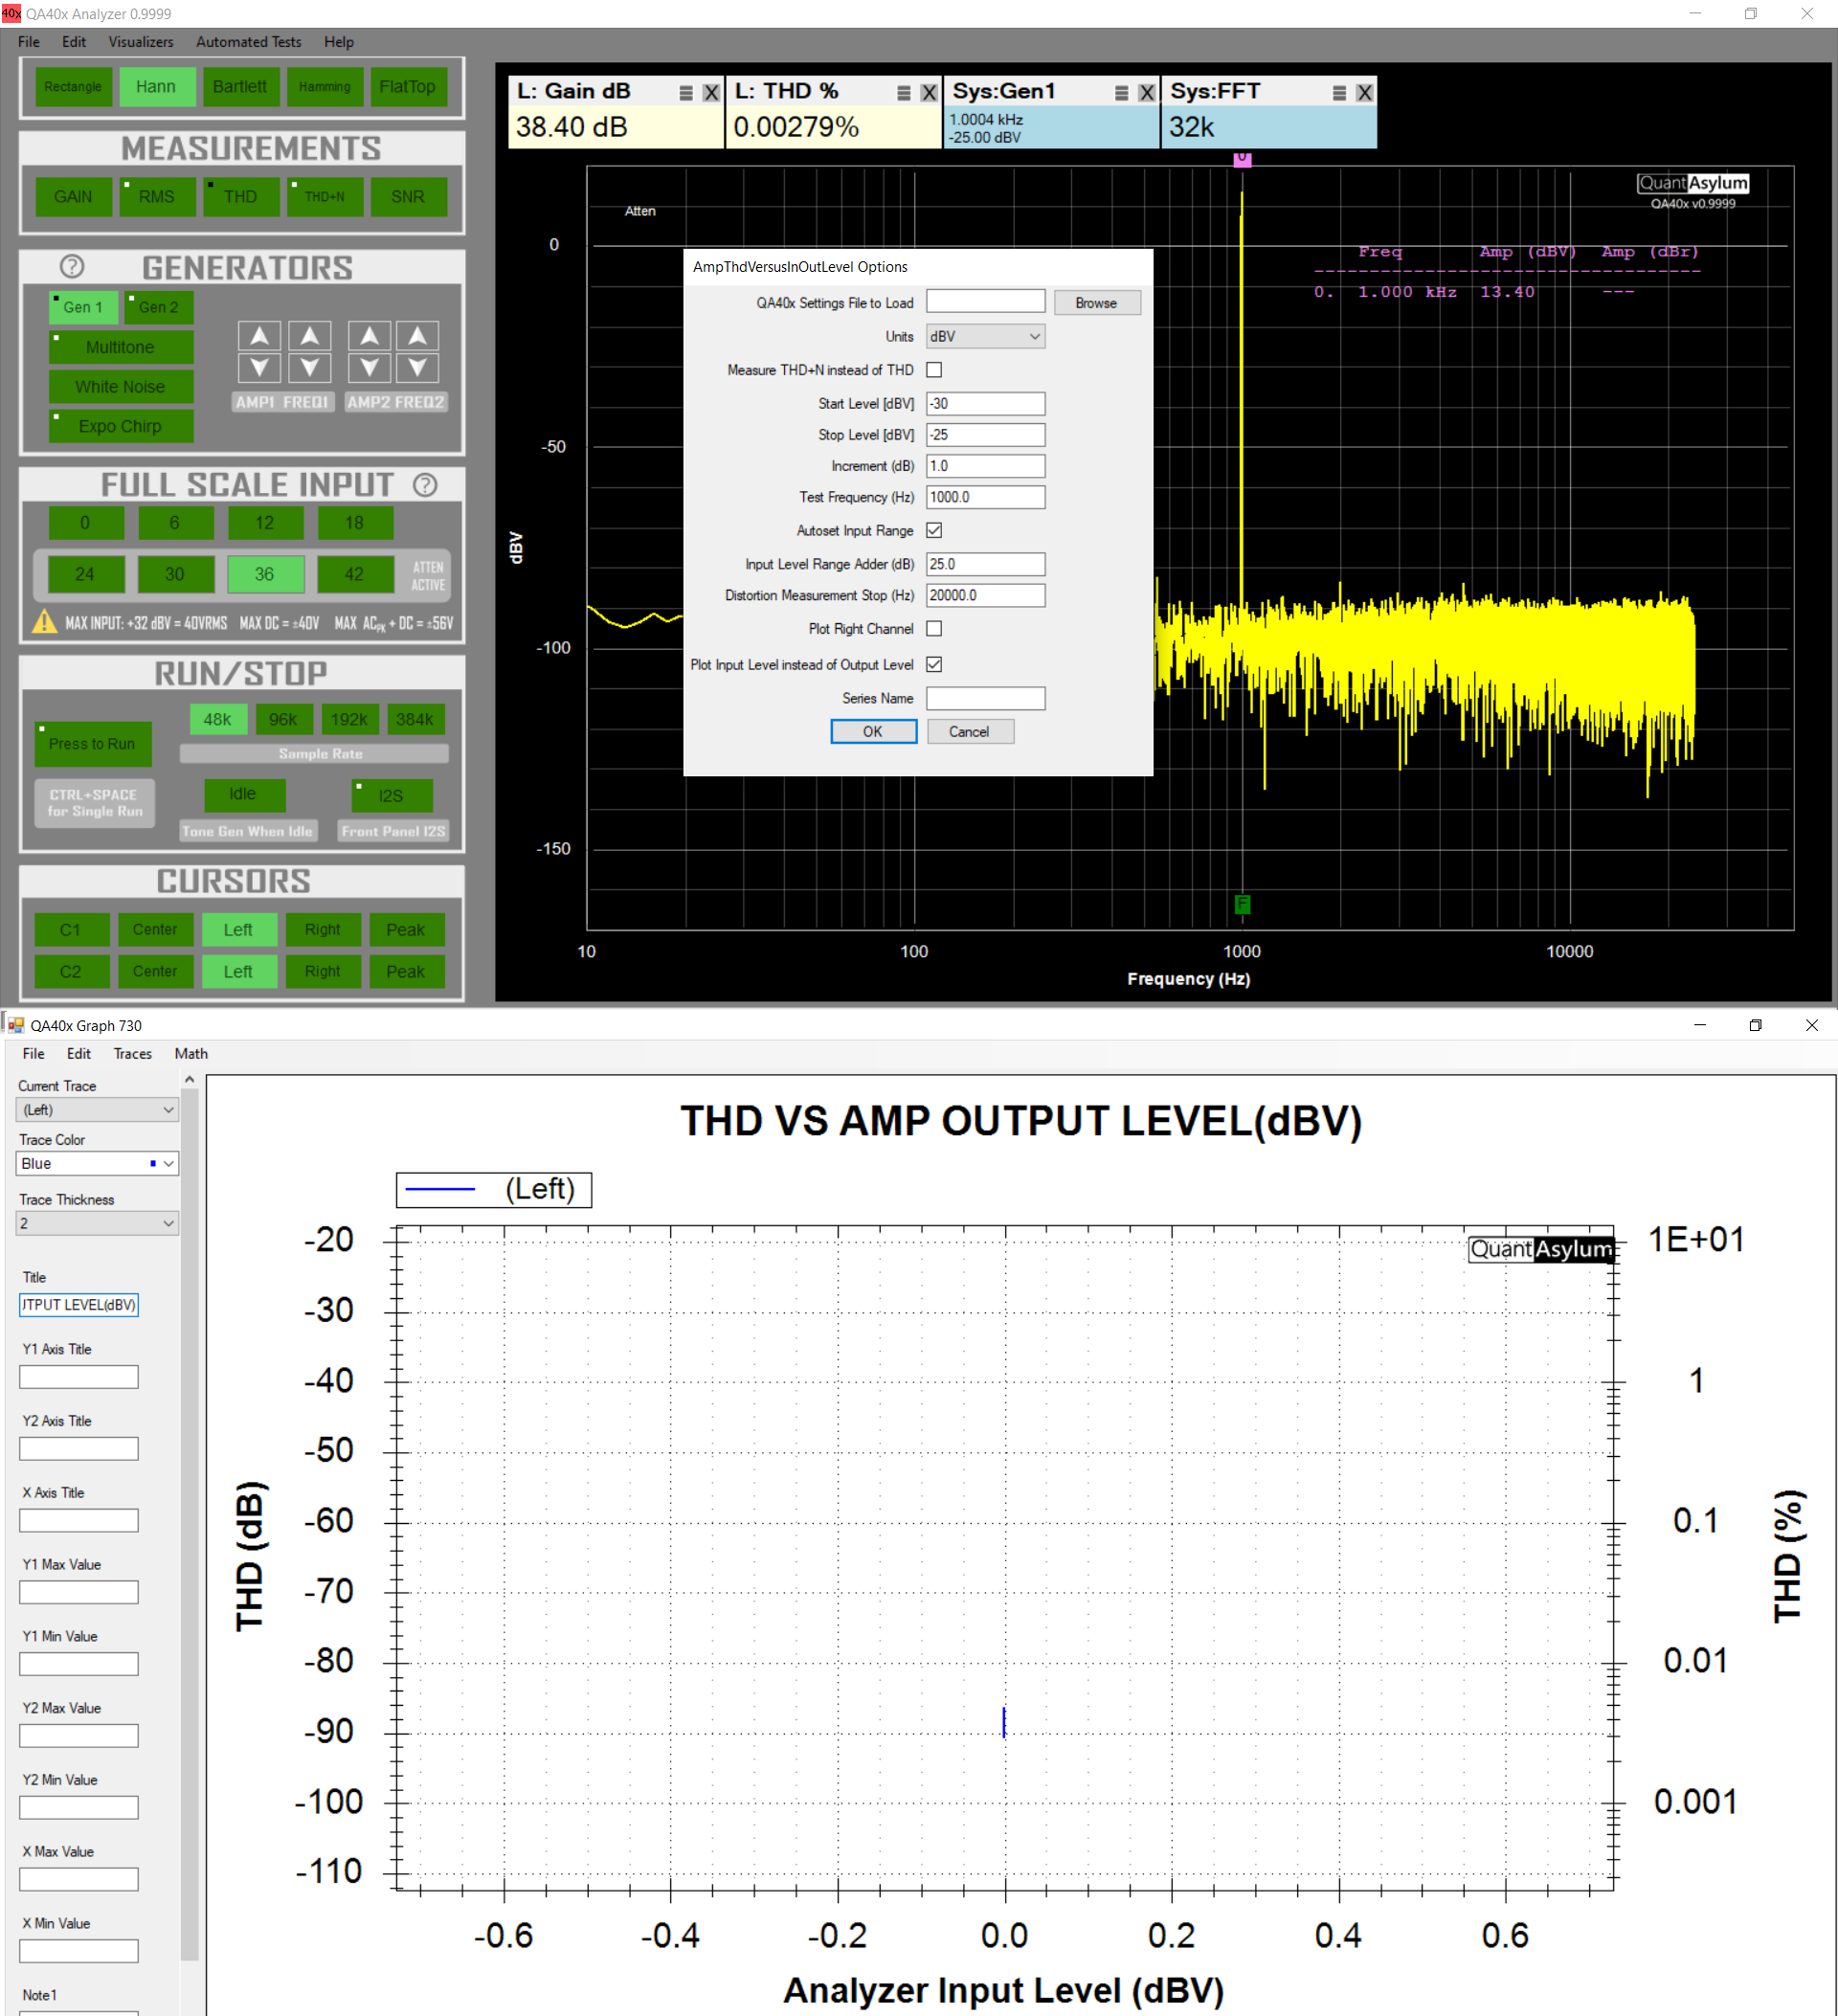
Is there something wrong here ?
Thanks for the hard work !
noeh