To make a check, I made measurements with the QA403 Audio Analyzer in closed loop.
At the beginning I used the same Analyzer Output Level values: -30dB to 6dB. I got:
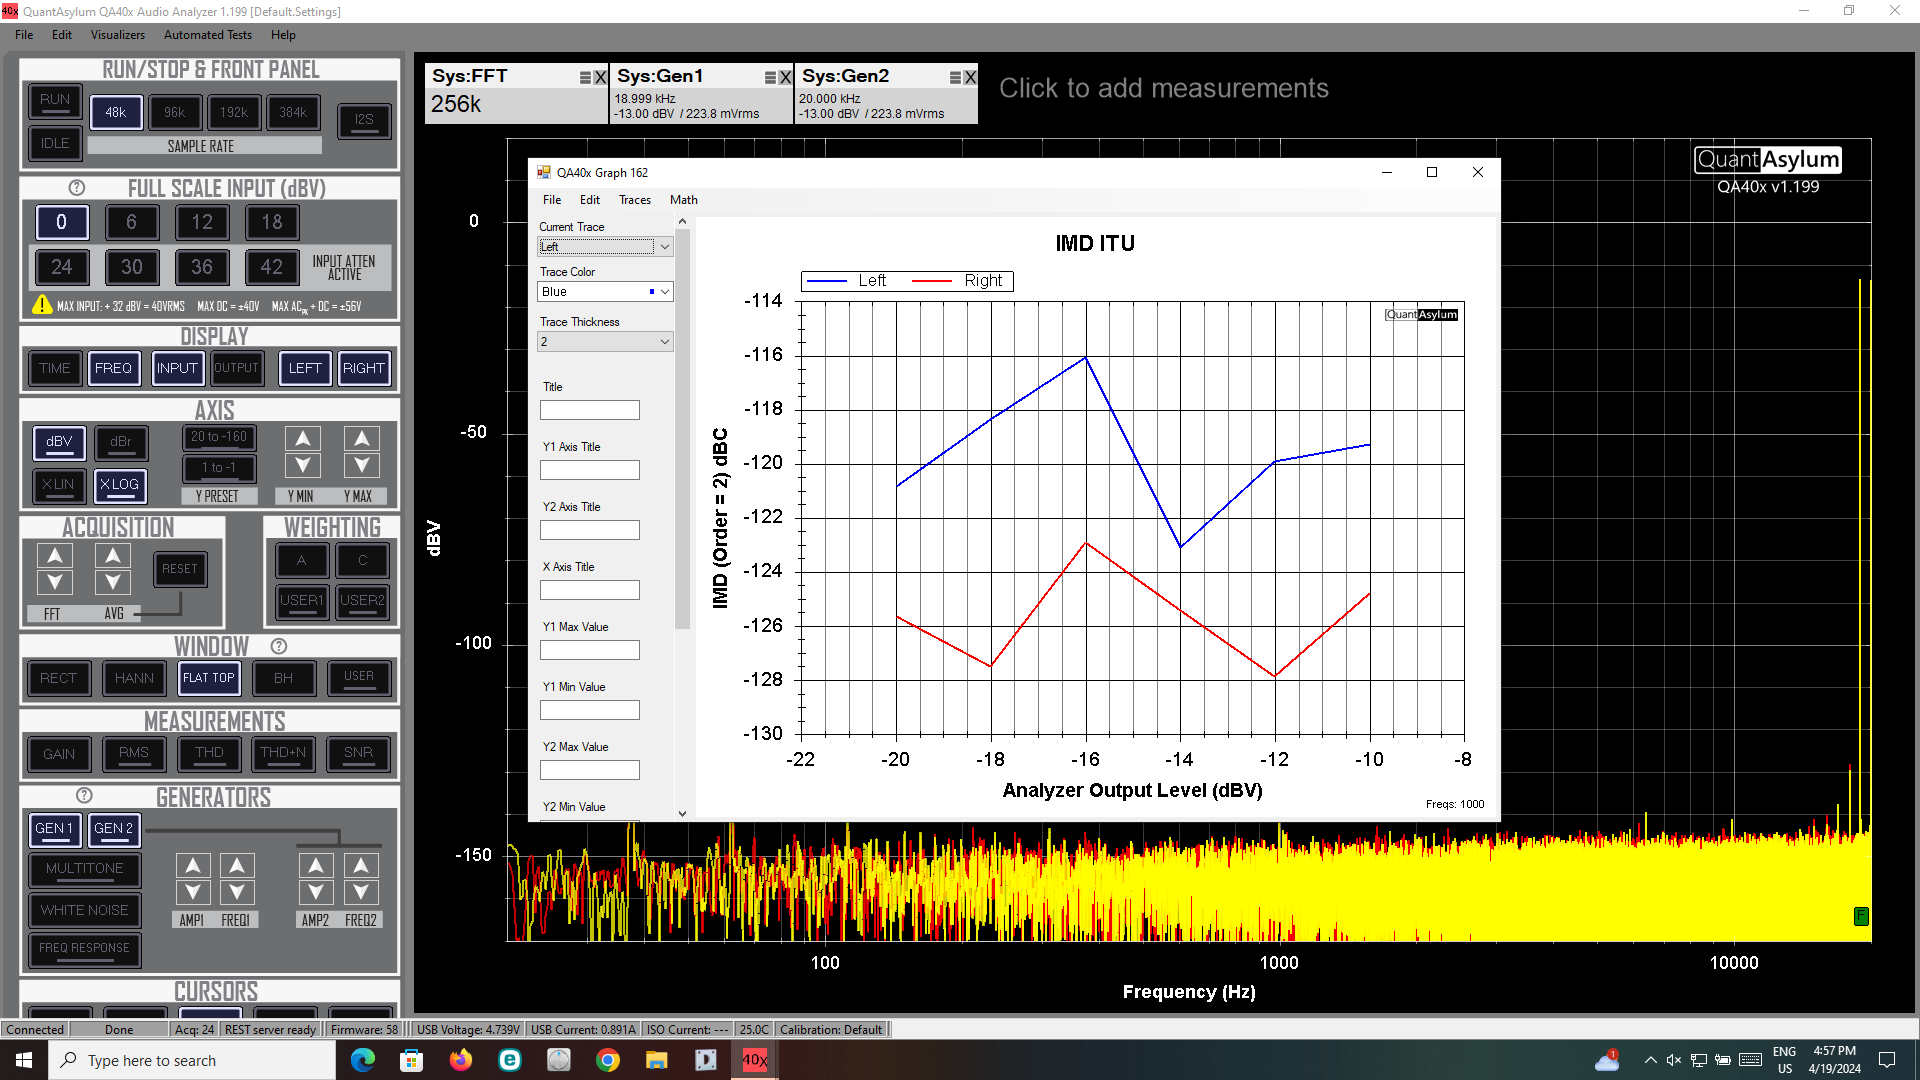
For IMD ITU values between -68dB to -108dB:
-68dB = 0.039%
-109dB = 0.0003%
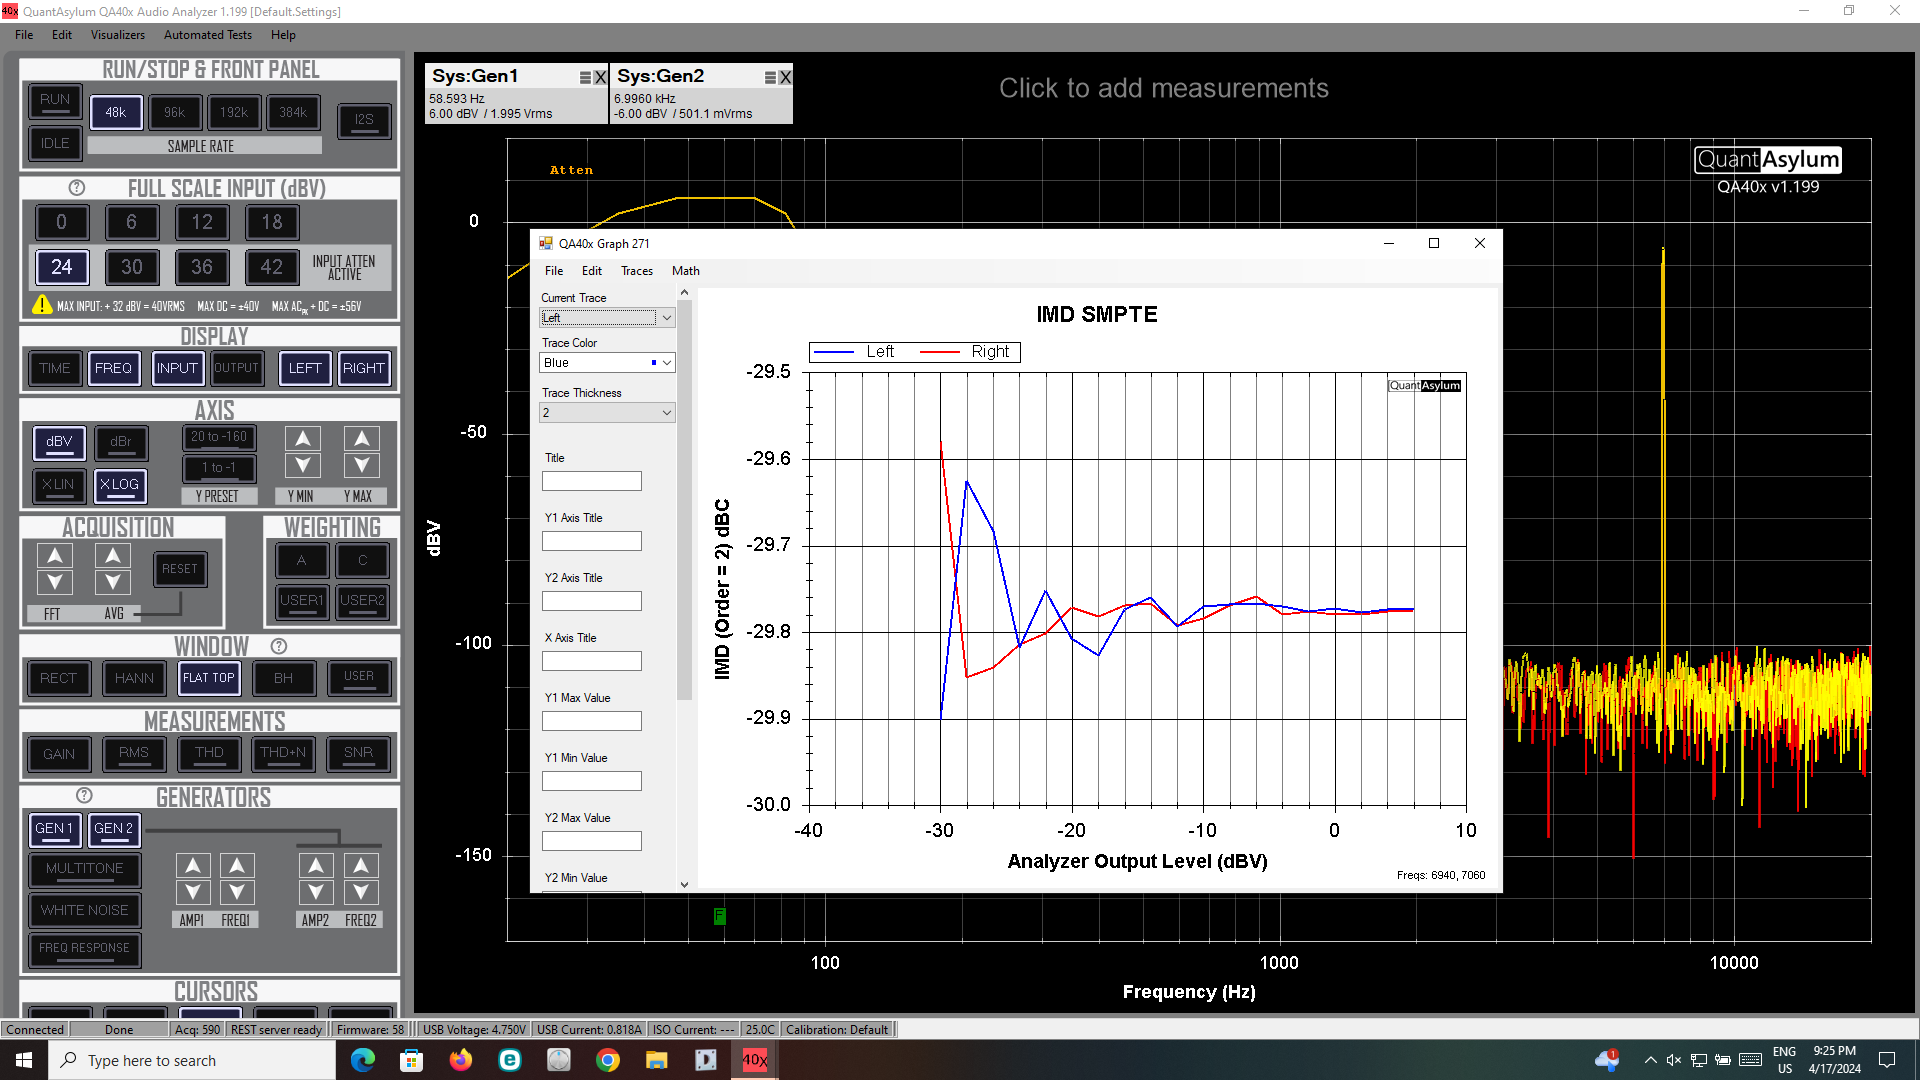
For IMD SMPTE values between 29.59dB to 29.9dB:
-29.59dB = 3.31%
29.9dB = 3.19%
I repeated the test in closed loop with Automated Test in Default mode (-20dB to -10dB). I got:
29.71dB = 3.26%
29.91dB = 3.19%
Because during the closed loop testing I obtained such high IMD SMPTE values and I think that the analyzer cannot have such a high distortion factor, please tell me where I am wrong?
In the “closed loop” test, I used short and very well shielded cables. When measuring THD+N I obtained very low values with these cables, but when measuring IMD SMPTE the values are high and almost equal to the values obtained when measuring the preamplifier where I used oscilloscope probes.
There’s clearly a serious problem with my SMPTE test numbers. And possibly something amiss with your QA403. But, @matt has been working on this a lot recently.
But, I can also see your 60Hz FFT line is really wide, which means you’re using a small FFT (large bin size). That might be faster, but the calculations will be wrong most likely due to spillage out of the ‘bin’ and into the measurements. I tried a bunch of FFT sizes and here’s the results with the bottom one being a 1M FFT (took several minutes to process)
I just launched The Automated Test, I didn’t change nothing to FFT value or anything else. When I’ll be back at home I’ll retake the tests using high FFT values. Thank you for your help!
Now it is clear to me where I was wrong and I thank you for your help. I thought that in the Automated Tests mode the settings for SAMPLE RATE, FULL SCALE INPUT, ACQUISITION, WINDOW are automatically set to the optimal values. I didn’t change anything, that’s why I was getting those bad values. Now I did the tests with the values indicated by you and everything is ok. I mention that I performed the tests in unbalanced loopback mode and that the R cable is a little longer than the L cable. I am going to buy two identical cables.
Hi @vidax, this is a common question and a source for frustration. I tend to think of the automated tests as something you do AFTER you have made the manual measurements and adjusted all the settings for the particular setup. That is, make the measurement manually and convince yourself looking at the spectrum that what you are seeing is making sense. AND THEN, once you have that all setup, the automated tests can vary some key parameters to help you better understand the behavior of the device you are testing.
Given the wide range of devices out there, from guitar pedals that are doing interesting things at -50 dBV input to 1 KW class D amps that are doing interesting things at +10 dBV input, it’s not really practical to expect the software to figure everything out. It could, but it would take a long time for it to “probe” the system and learn what is being measured. It’s much more practical for the engineer to get close based on their expertise, and then let the system vary some key parameters.
That said, it’d be useful to hear opinions on how this could work. Maybe there are 4-5 global parameters that are present on ALL automated tests, including FFT size, windowing, weighting, etc.
What I would really appreciate is having all the ‘stimulus’ settings always visible somewhere on the main screen: FFT size and averaging, generators’ levels and frequencies, measurement bandwidth, sampling rate and windowing. This could make it easier to hop into any automated test - as knowing exactly what the base setup is user could then focus on the parameters to vary in the automated test screens. This could also aid clarity on the main screen by separating results from stimulus.
Of course having all those settings available in one place would be the icing on the cake . . .
Hi Matt, the QA403 audio analyzer is something I have wanted for a long time. It is extremely useful for optimizing the audio devices I build and for the fact that it puts me in a position to remind myself of forgotten knowledge or to learn new ones. The forum is of invaluable help. The logic of using it as you thought is correct, jumping over certain steps leads to an incomprehensible operation. As you said, user opinions related to different ways of use will form an extremely valuable database for everyone, I will try to contribute to this as well. Matt, among the users there are also some “old school” people who are used to analog electronics, I am one of them, but who have a lot to learn and are trying to keep up with the young people who are trained on digital technology.
There’s an “auto” button on my DSOs which I never ever use. It decides what I want to measure and displays what it thinks I want to see, and at the same time, it changes all my settings.
I have used the Auto Setup function on my DSO many times, especially at the beginning, when I was not familiar with its operation. By pressing this button the oscilloscope will automatically adjust the horizontal time base, vertical scale and trigger mode according to the input signal to provide a triggered stable display.