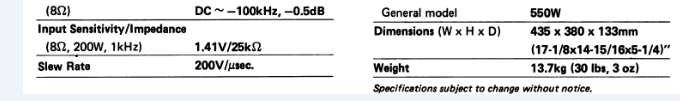
This spec here gives you an idea of the amp gain it had when new. 200W into 8 ohms is 40Vrms = 32 dBV. And they claim to hit that with 1.41V = 3 dBV in. So, they are telling you here that the amp gain is 32-3 = 29 dB. But you are measuring 23 dB.
Is your speaker load using the 6 dB of attenuation that is built into the load that you shared earlier?
Last week I measured the RMS with a generator set at 1.6v input and 42v at the output, this was just before clipping. DMM for measuring RMS and a Scope to see the clipping point.
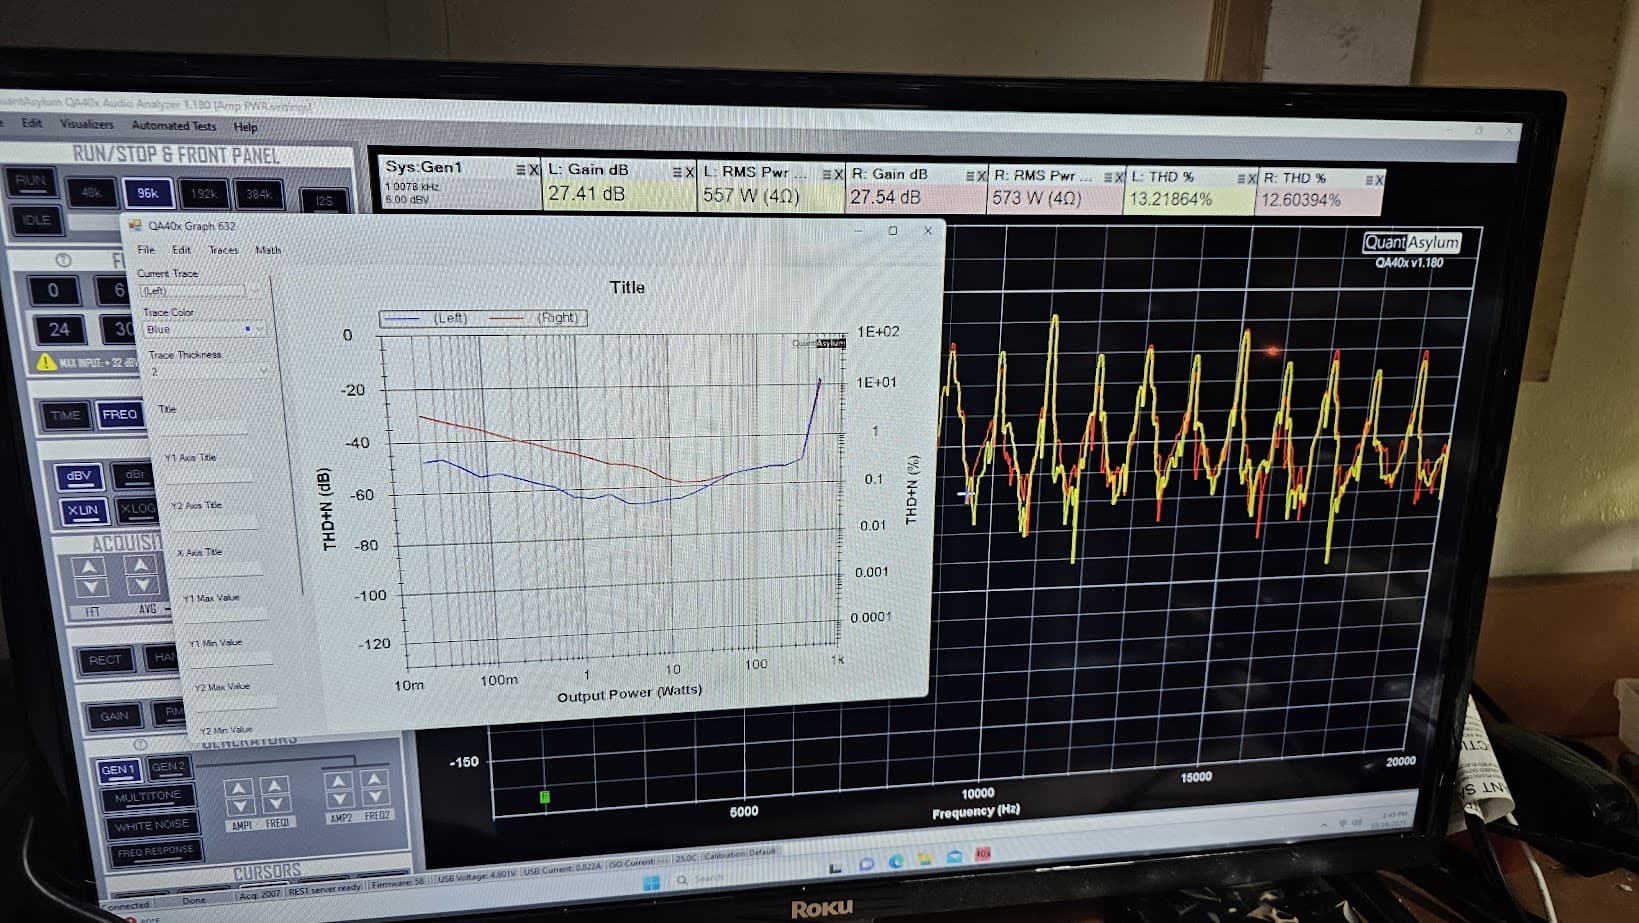
OK, so the true amp gain is 29 dB, which is what the spec says. So the last run you did way overdrove the amp. Reduce your start/stop levels by 6 dB and try again and see what we get
Association between the two?
I can see from the information provided today from MATT that several steps he explained do in fact answer many of these. Now I am anxious to continue the efforts, with the help of many.
The video provided by VAL does cover these test in greater detail, but lacks the step by step procedures that MATT has provided. I am confident that many people would like these addressed.
Hi @YamahaCA, if you have the exact test conditions from the manufacturer, those can be replicated. But generally, those aren’t given. For example, the THD at 100 kHz is a bit vague. What bandwidth? It doesn’t say–we must guess.
And so, you are on your own on making sense of a lot of these specs. And I think @VAR does a great job of talking through this in his videos and relating his measurements to the manufacturer specs. But some of this stuff gets pretty archaic. The IHF-A Network in the SNR section is pretty antiquated. So, you’d need to make a custom user-weighting mask there once you found out what the IHF-A weighting looked like if you wanted to replicate precisely. Or, you could confirm the IHF-A is a variant of A-weighting and just apply that and call it good.
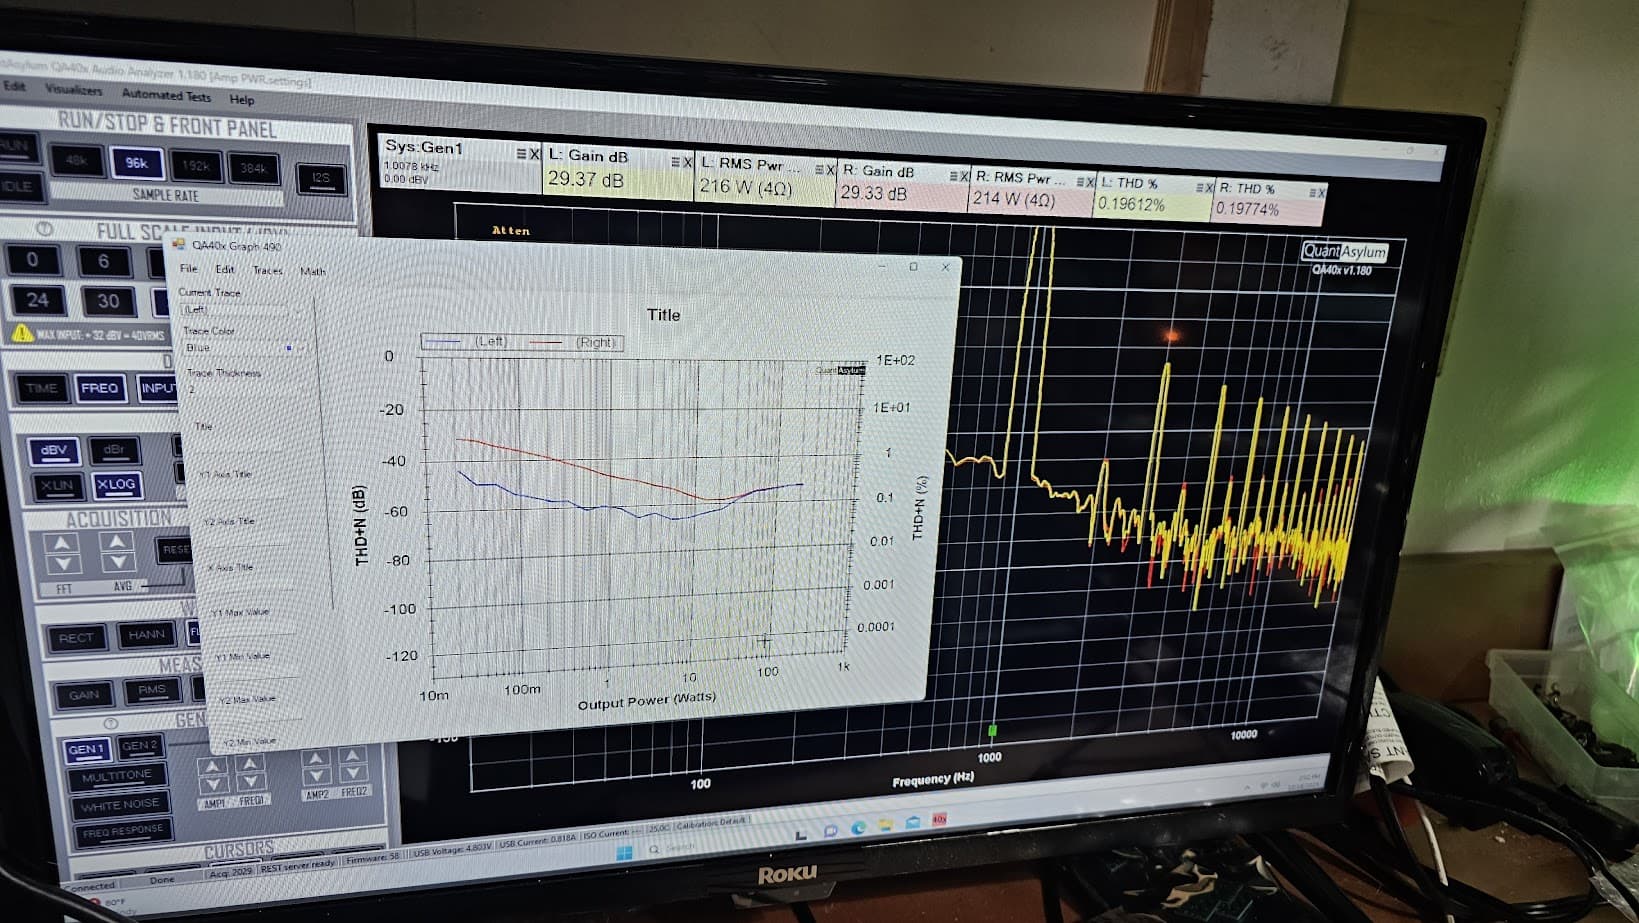
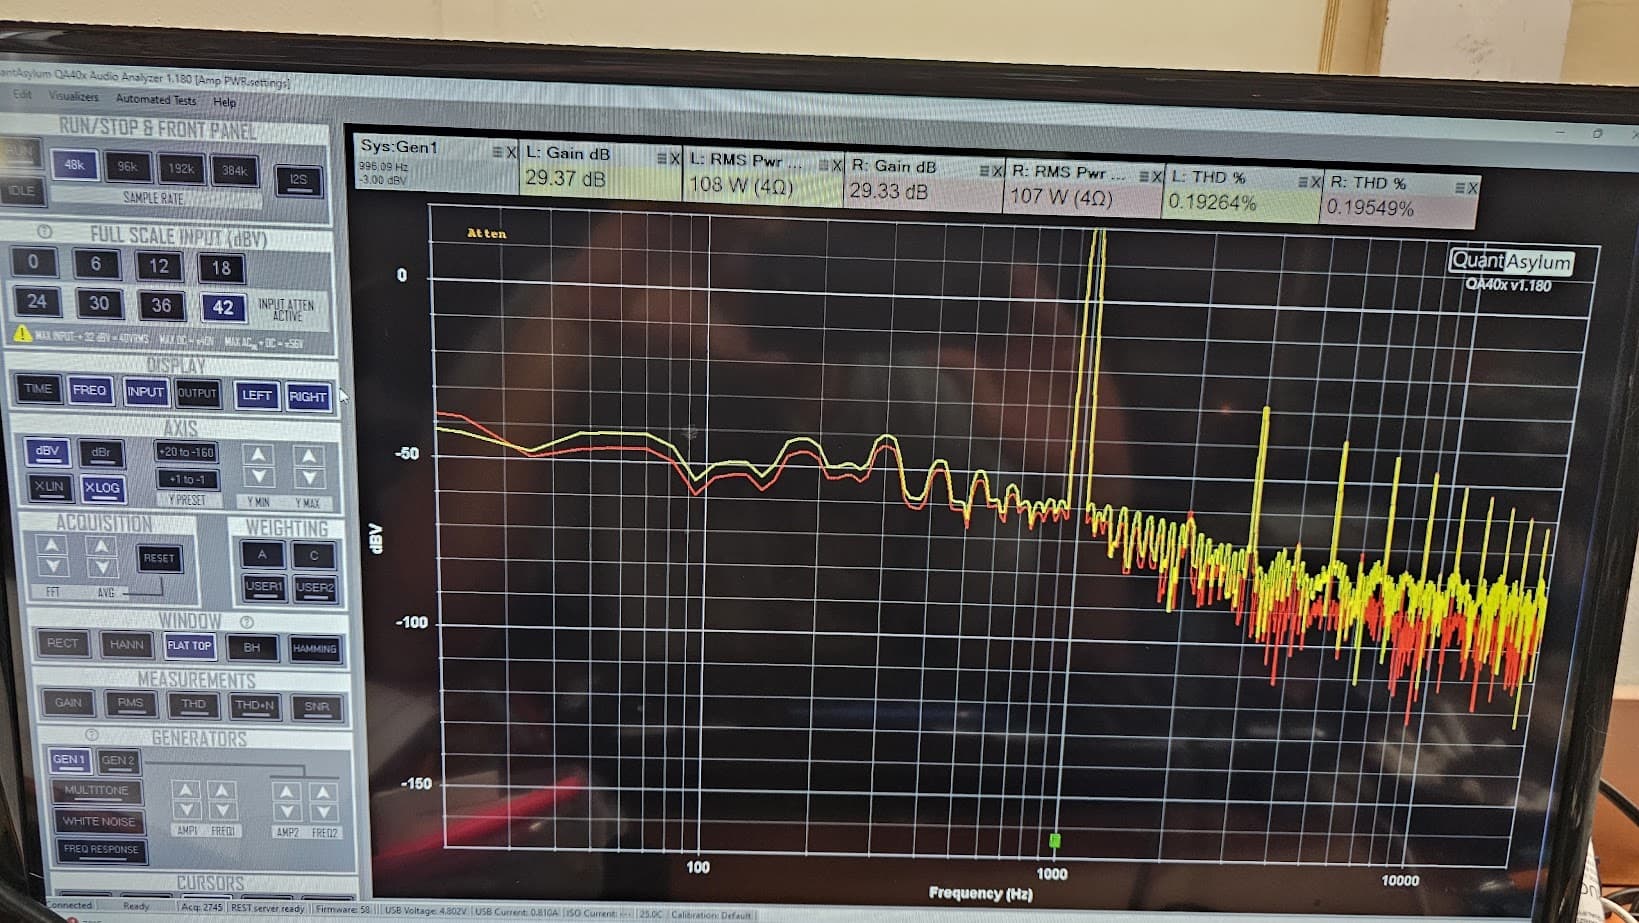
In short, it might seem like there’s a push-button approach to measuring, but that’s not usually the case. You’ll need to make a fair number of assumptions and guesses along the way. And then there’s the issue of ageing components (mostly caps) in a 50 year old amp. @VAR knows more about this than most and maybe he can talk about this more and they might impact THD and other measurements. But I have no idea how that might contribute to degraded measurements generally. For example, your amp is showing 0.1% THD at 10W, while the spec 0.0006% at 100W. Additionally, your amp is showing a fairly large spread between THD of left and right channels. If it were a power supply issue, you’d expect to see some 60 Hz IM products clustered around the 1 kHz. But those aren’t there, and so something else is going on.
Finally, I note again that you continue to show THD+N measurements when the instructions given above have been explicit (twice) about clicking a checkbox to make a THD measurement. You have to follow procedures very carefully if you want measurements to make sense. Ignoring attenuators skipping steps in the measurement procedure will leave you always disappointed!
If you have specific questions about how to make a specific measurement, please ask. Note that at the core, you need to understand what each of the measurements mean. I think the Analog Devices paper linked HERE is a definitive source.
I have only had one vintage amp (1981) specify THD + noise instead of THD %, and that was something I measured a few weeks ago. I have found problems with my cabling around the load to the QA40x can cause the differences with left and right channels. I just spent 2 days re-wiring my loads with 10 & 12 gauge OFC wire and the results look good. The damping factor measurement, which is 8/the amplifier’s output impedance, can be figured out using the Amp Output Impedance plug in. The starting impedance would be 8ohms and the 2nd impedance is 100,000 ohms, or whatever the max is that you can set it to. When it asks to set the load to than impedance, just remove a lead from each dummy load. I also set it up so that the power is 1w/8ohms at 1khz. Most amps don’t specify a frequency for the damping factor, but a few do. I have only had 1 amplifier with a damping factor better than what was specified- most are way less- so keep that in mind. My experience is that caps are not necessarily bad just because they are “old”. The thing that degrades the most with weak or bad caps, is the SNR or THD + noise due to 60, 120 & 180hz power supply ‘hum spikes’, not so much THD. You also need to vary the input attenuator setting to optimize the THD and SNR- one will often be better than the other depending on your attenuator setting so you have to figure out which you want to look the best, or I guess you could do 2 measurements.If you are mainly trying to provide paperwork to a customer show the performance of their repaired item, I would provide graphs(plots) of the following:
Max power (rated power) THD/SNR @1khz into 4/8ohm loads
THD/SNR @1khz @ 5w into 4/8ohm loads with the gain set for ~29dB if possible
Frequency response (20hz-20khz) at 5w into 4/8ohm loads
Phono stage frequency response (-46dBV input, 20hz-20khz) measured at the tape monitor output. I would use the RIAA HiRes Playback user weighting file when doing this measurement. If you have a preout jack and tone bypass switch you can use that, but using the tape monitor output will give the best results.
Phono stage THD/SNR @ 1khz measured at the tape monitor output with a -46dBV input signal. I am assuming a moving magnet phono input.
System noise (20hz-20khz)- terminate line level input into a short or load, set the attenuator to 0dB and the amp or preamp gain for a decent amount of gain (29dB is what I use for an amp or integrated amp when I can),and set the scale for dBV and you can see the level of noise (worst noise spikes, which are typically the power supply hum spikes)- sometimes there is an A weighting in the noise spec so you can switch that on.
I would not to a lot more than that as it takes a long time- probably 6hrs- to try to measure everything. Each piece of gear is going to require different settings and tweaking, which would make automating a standard batttery of measurements difficult.
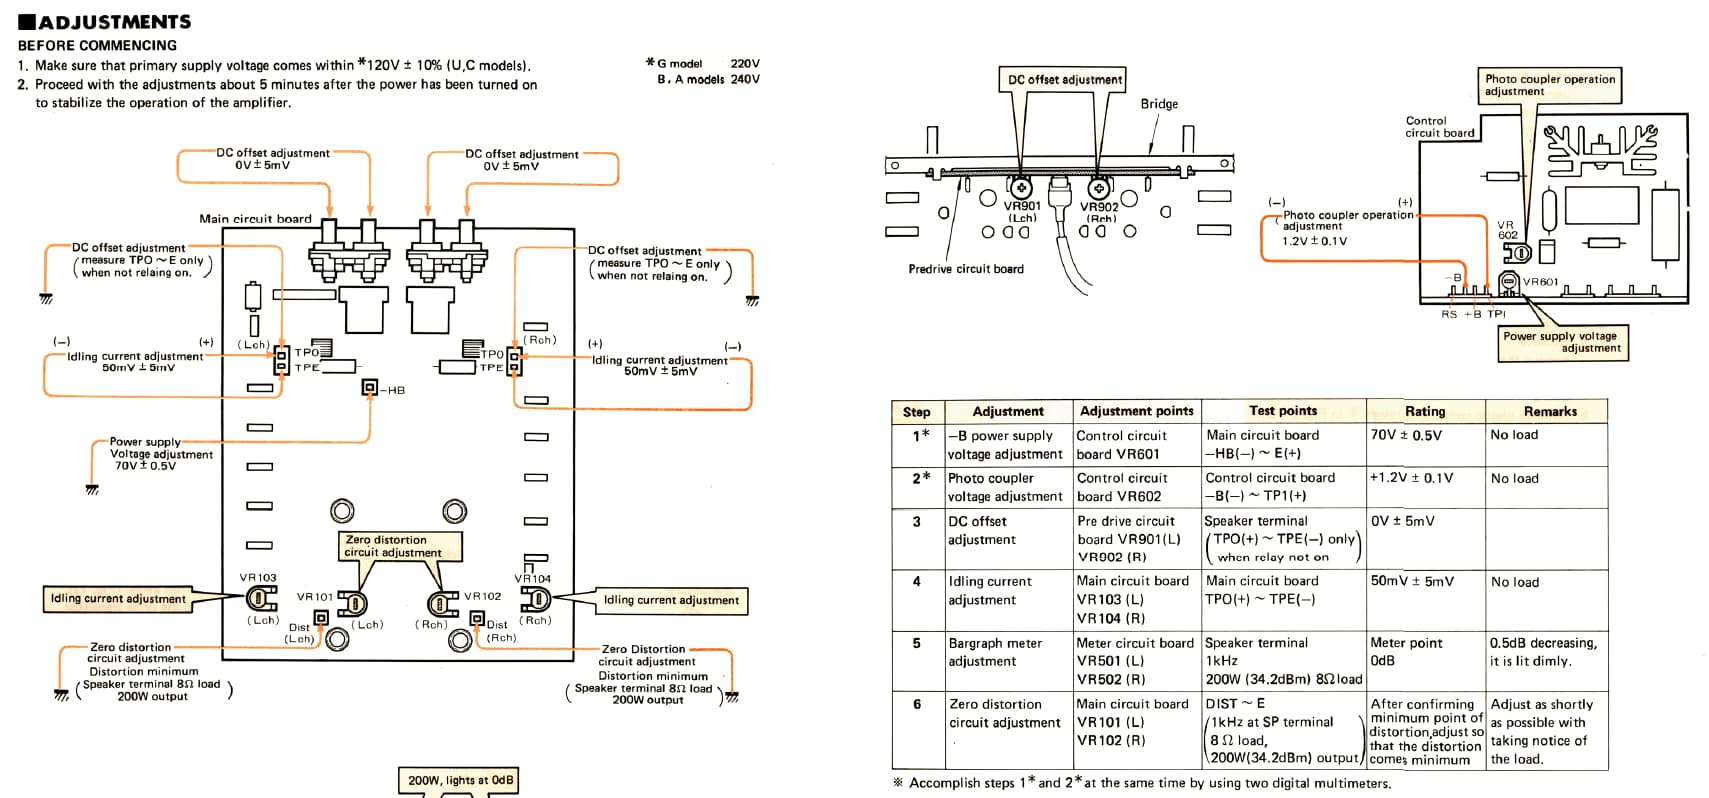
As stated last night, I stopped and went back to the calibration procedures. First thing they ask is to set the photo coupler voltage and as typical I am at 8.25vdc instead of the 1.2vdc as stated. I guess it doesn’t matter since the X Power is firing.
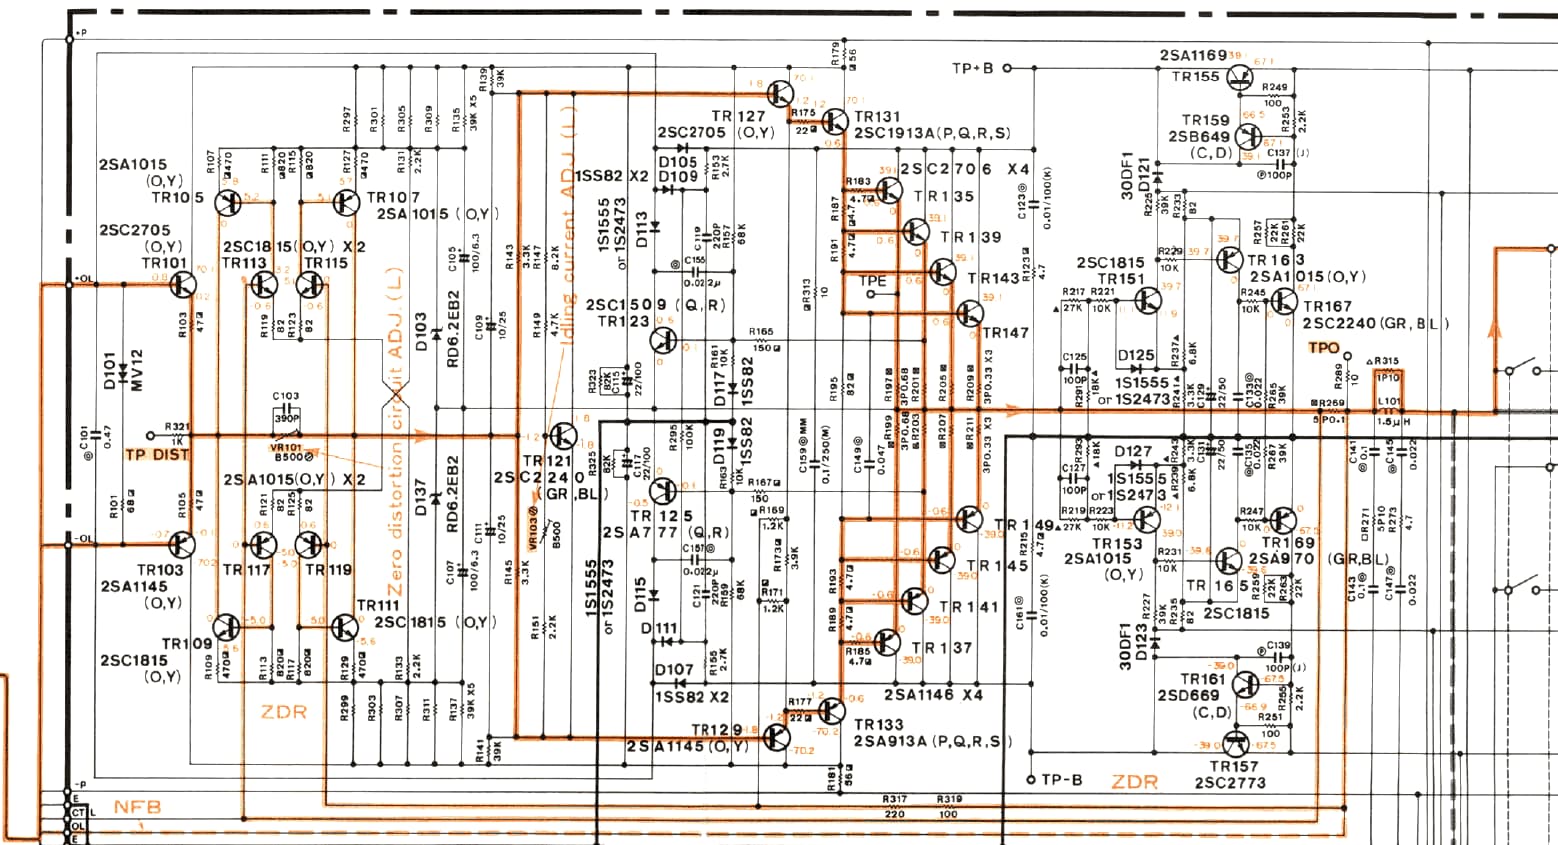
In the calibration procedure for the ZERO distortion circuit, it states to measure THD at DIST and E. This is not possible with the QA, when I move the INPUT leads to this location it instantly blows the Main PS 15A fuse.
At first I connected the QA to the SPKR terminals and ran the THD test, no matter how I adjusted the VR’s the value didn’t change. So I thought maybe I should move the QA Inputs to the DIST test locations.
Now I am thinking that what I should be doing is measuring DCV at the DIST locations and adjust to 0.00vdc?
I would adjust VR102/101 for the lowest distortion reading on the qa403 with the amplifier putting out something more reasonable like 50w/ 8ohms or 100w/4 ohms. That is after you set the offset and bias adjustments.