Question about which SNR and THD+N measurements to trust

Hello, my name is Bartosz and I purchased the QA403 and QA451B to test a Class A amplifier I am building. I am new to taking measurements so this is a learning experience for me, so I will be asking some silly and newbie questions.
This is the setup I am using to test my amplifier:


I am struggling because I am finding I am getting two very different results when measuring the SNR and THD+N at 5 watts depending on which Full Scale Input (dBV) setting I use.

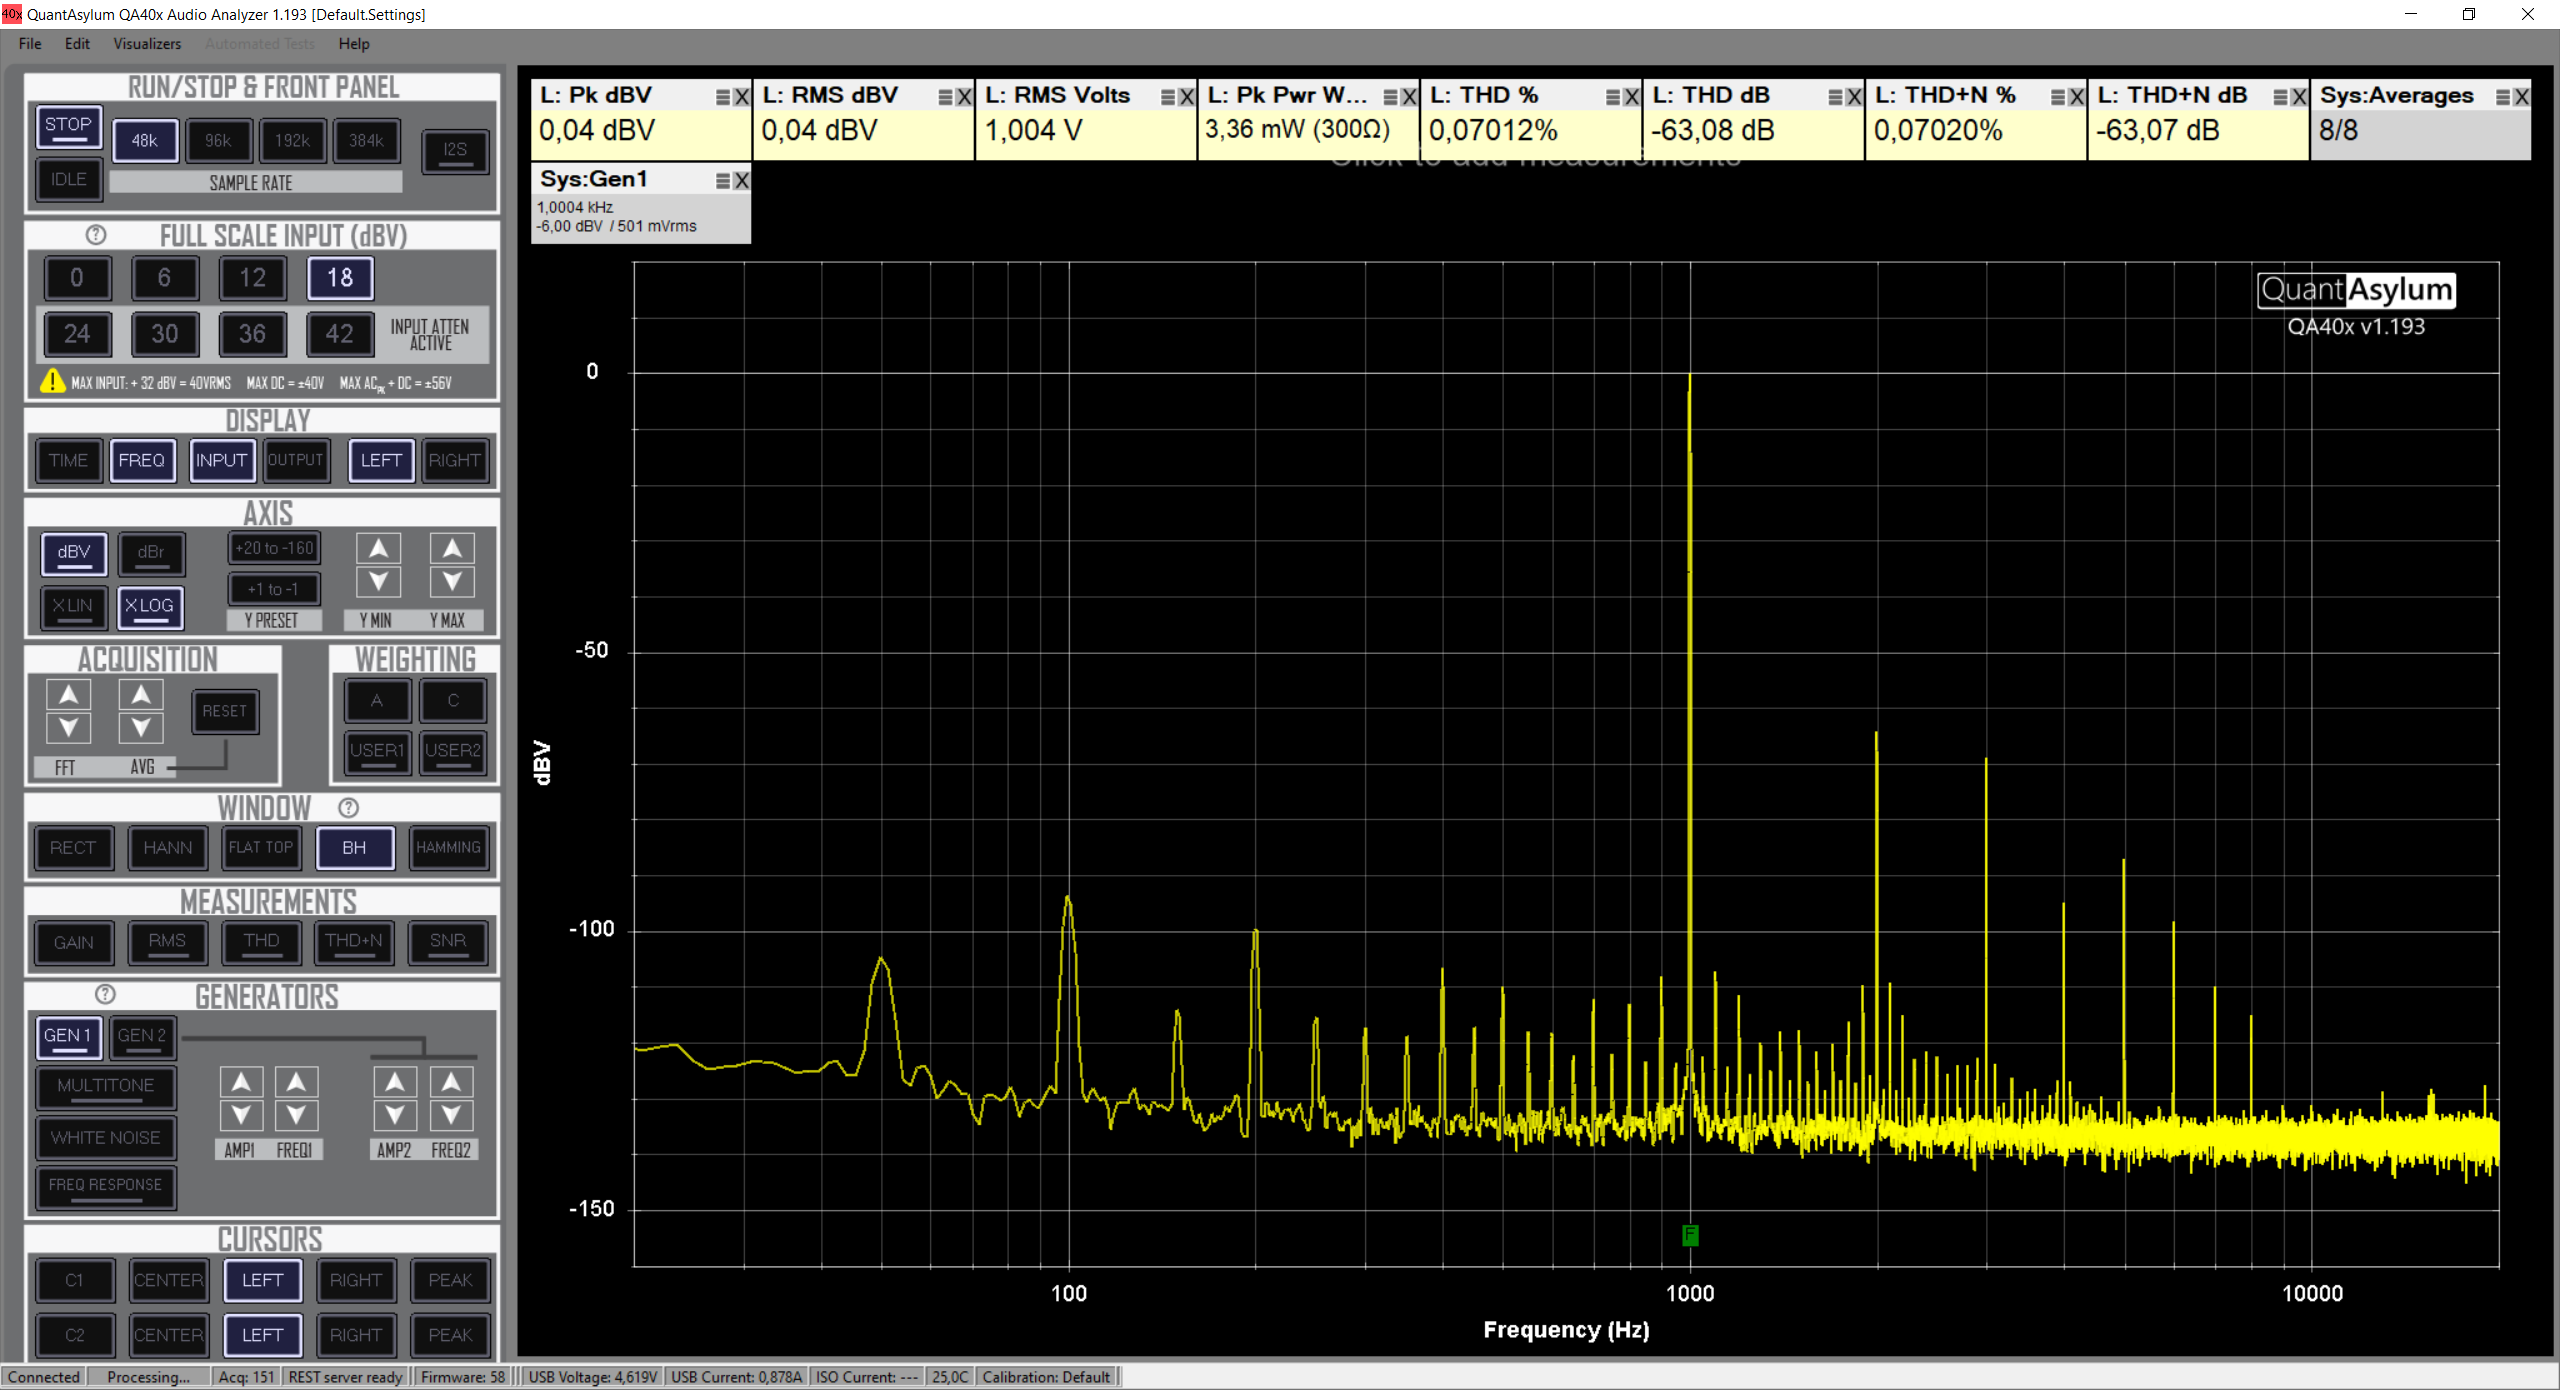
For example, I am using the QA451B which has an attenuation of -12dB. So I set up my simulation and ensure the external gain is set to -12dBV. Looking at the results when I use this setting, I have a RMS dBV of 16.09 dBV so I choose the Full Scale Input to be 24dBV. Because of this it will attenuate the input signal. Doing this, I get a SNR ~89dB and THD+N around -88dB. This is shown in the screenshot below:

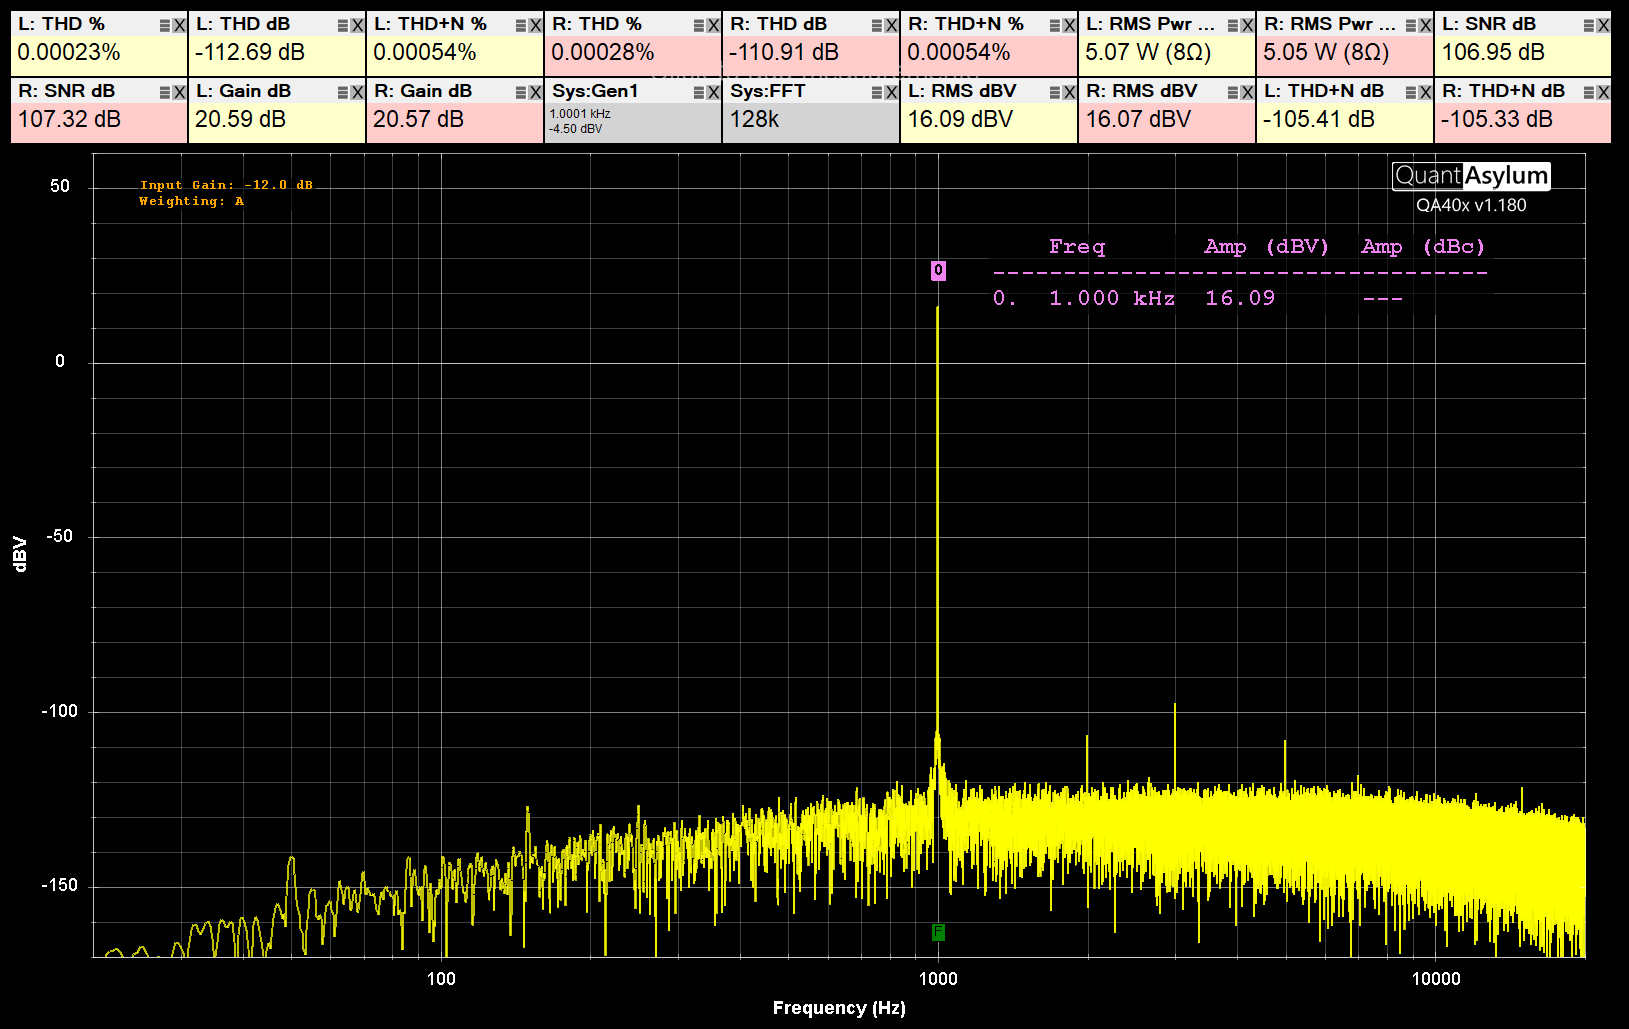
However, I know the QA451 attenuates the output. So I zeroed the input gain to see what the QA403 was received. When I did this, I found it would have input of 4.09 dBV. This is shown below:

As this is much lower now, I thought I could adjust the Full Scale Input to 18 dBV and this would no longer attenuate the input on the QA403. Doing this, I found the the SNR now was 107 dB and the THD+N was -105.41dB. This is shown below:

So, the performance has gone up significantly! The SNR and THD+N match the simulation perfectly. But it seems far too good to be true as I would imagine the real world SNR would be much worse than the simulation.

I wanted to ask this forum; how do I know if the results are too good to be true? Which set of results should I believe? Is there anything I can do further to validate these?
Please note I am new to this so you would need to explain in simple terms haha.

Thanks for your help and patience!

1 Like

Hi @Bartosz, this is a very good question and a common question on any test gear with multiple input stages. As you increase the input range (eg go from 6->12 dBV full scale input), you add noise but you reduce distortion. As you decrease the input range, your reduce noise but increase distortion.

So, let’s say your signal is -2 dBV and you want to measure THD+N. In that case, you want to be very close to the input signal (minimize noise). You’d probably want to start with 0 dBV full scale and then see how 6 dBV looks.

Now let’s say your signal is -2 dBV and you want to measure THD. In that case, you want your input to be quite a bit away from your signal level. So, you might pick 12 or 18 dBV full scale.

Now, the rules here aren’t hard and fast. This is true on RF spectrum analyzers too. But as you adjust the full scale input, you want to look at how the harmonics are changing. If you reduce the full scale input, and the harmonics go up, then you are starting to overload the input. If you increase the full scale input and the harmonics stay the same, then you are raising the noise floor without any benefit to distortion so back off on full scale input.

In general, if you aren’t sure where to be, experiment in loopback using the different input ranges. And make plots in loopback of THD and THD+N measurement for different input levels. There you can graphically see how the THD and THD+N will change for different input ranges. that will also inform the equipment limits for various ranges, and then you can see where you want to be for a DUT.

And in general, you want to find the settings that will give you the most optimistic measurement. It takes practice and experience. But there are so many settings on an audio analyzer (FFT, window, full scale input, etc) and each can have a sizeable contribution and yes, it can be sometimes difficult to know.

1 Like

Hi @matt - thank you for taking the time to reply. This is very well explained and I really appreciate it. It is quite daunting playing around and working out what is going on.

I have spent some time measuring the loopback of the QA403 and then also measuring the amplifier at the different full scale input values. I collected the following data:


So, this may be a simple way of looking at it, but would you say that the “best” value for each of the measurements would be a good indication for the specification of the amplifier? For example, in the table when I did the amplifier measurements, and the best measurements are:

  1. L THD (dB) was -113.42 dB at input of 18 dBV
  2. L THD+N (dB) was -99.95 dB at input of 12 dBV
  3. L SNR (dB) was 100.32 dB at input of 6 dBV

I also plotted the graphs for these:

It is interesting how there is a big dip when you go up from an input of 18 dBV to 24 dBV. In this case, how would you accurately measure an amplifier with a higher output if you were forced to attenuate it when moved to an input between 24 and 42 dBV?

Hi @Bartosz, these are excellent curves. So, to generalize from these curves, there are a few observations:

  1. For DUTs with THD worse than -110, the input range doesn’t matter much as long as the atten is off. 0, 12 and 18 will get you close.

  2. For DUTs with THD better than -110, then input range matters more and you need to pay more attention to the setup.

Similar statements can be made for THDN.

Now, the loopback is a bit pessimistic, because the ADC on its own can deliver THDN around -114 dB when driven from an extremely high quality source such as the Topping E70 Velvet DAC.

It is interesting how there is a big dip when you go up from an input of 18 dBV to 24 dBV.

Yes, that the due to the front-end attenuator clicking in. That attenuator provides 24 dB of attenuation. So, that raises your noise floor by about 24 dB on paper but it also increases your maximum input level considerably so that the next range of gain adjustments can do their work. If you look at the SNR of each range, you see it’s roughly the same. So, noise floor at 0 dBV is -117 RMS (20k, no weighting). And the full scale input is 0 dBV, so that suggests a dynamic range around 117 dB. And at 6 dBV full scale input, the noise floor is -113 and the max input is 6, so 119

In a table, you get:

Full Scale Input (dBV) Noise 20 kHz (dBV) DR
0 -117 117
6 -113 119
12 -108 120
18 -103 121
24 -82 106
30 -82 112
36 -81 117
42 -77 119

Note that when the switch from 18 to 24 occurs, the dynamic range shifts a lot, and doesn’t really come back until you get to the 36 and 42 dB ranges. This is due to the input opamp (OPA1612) objecting to the size of the attenuator resistor (roughly 6K–a divider made from a 93K resistor on top, and 6K resistor on bottom gives you 24 dB of attenuation with an output impedance out of the divider of ~6K. The OPA1612 has a great noise voltage, but a middling noise current. A JFET amp would do much better there, but the distortion would suffer.

In this case, how would you accurately measure an amplifier with a higher output if you were forced to attenuate it when moved to an input between 24 and 42 dBV?

Once you have learned the sweet spot for the measurement you want to make, you can then use an external resistor attenuator to get your amp back into that region. That is why on the QA451 there’s an internal 12 dB attenuator. Higher power amps would want a bit more, and lower power amps would want a bit less. There’s a post HERE on using attenuators, and if you search the forum for attenuator you’ll find a lot more there too.

And in the realm between -114 dB THDN and -123 dB or so, that brings you into the world of notch filters. The aim with a notch filter is to knock down the signal a known amount, while leaving the noise in tact. That reduced signal level means the “contaminating” harmonics that form in the ADC don’t materialize, and that let’s you push to the next level.

More on notch filters HERE

PS. What amp are you measuring? The numbers you are measuring are quite good.

2 Likes

Hi @matt - that makes a lot of sense and is very helpful. The information you provided will give me lots to think about when testing and making measurements.

Ohhh I am thrilled you mentioned the amplifier and the measurements are quite good (as it means I am going in the right direction). The reason is, for over two years now I have been learning about amplifiers and I have designed one and built the first prototype (so it is pretty messy still as it is my first attempt - final design will be cleaner). My goal is to one day make these amplifiers fulltime and have them built in Brisbane, Australia. It is a class A amplifier which gets to 25 watts now, but I have custom made heatsinks which will take it up to 30 watts. Here are the photos of the first prototype. Please note: the enclosure is just an off the shelf Takachi enclosure. The reason is, I am first trying to perfect the electronics inside and then I will design the enclosure.

That is why I am really relying on the QA403 to give me specifications to see how the prototype performs.
I have one final question which I have not been able to figure from looking at forums. I want to check and take measurements of the amplifier across 20Hz - 20kHz. But I found at 15kHz it does not show any results.
For example, here is the measurement at 5kHz:

Then again at 10kHz:

However, when I move to 15hHz I no longer get any results and it shows THD as negative infinity.

If I look at the frequency sweep of this amplifier, it should not have any issues:

Sorry about all the questions, but it is an absolute pleasure to learn how to use the QuantAsylum gear. So I look forward to getting an understanding so I can continue on in future!

Regards,
Bartosz

1 Like

Hi. Perhaps just set a sampling rate of at least 96Khz and expand the upper measurement frequency in the THD and THD+N context menus. With a fundamental of 15 Khz, the first useful harmonic is 30Khz, so if you do not expand the upper frequency the system will not find harmonics to measure.

2 Likes

Yes, @Bartosz, @Claudio is correct. If you right click on RMS (or THD or THD+N) you will see “Measurement Start” and “Measurement Stop Frequency”.

If these are at 20 kHz and your fundamental is at 15 KHz, then the system will ignore the harmonics beyond 20 kHz. And so, as Claudio says, set the sample rate higher and extend measurement stop frequency to 46 kHz or 61 kHz and that will allow you to capture 3rd and 4th harmonic.

But, also think about a 19/20 kHz IMD test to help understand linearity at higher frequencies. I’ve not seen a relationship relating IMD to THD, but perhaps it is out there.

Very nice work on the boards!

1 Like

Thank you very much @Claudio and @matt - this has done the trick!
Now for me to do my part and delivery a good amplifier!

I got a similar kind of problem:

With the Attentuator i got a really good THD

Its a headphone Amp, so the signals are smaller in general. Would it be better to go for seperate THD and Noise measurements?

Cheers

I had to do a 2nd post, sorry for this:

Now i got better noise but worse THD.

There is a tradeoff between THD and SNR based on the attenuator setting. I typically adjust the attenuator to give me the best SNR as the THD is still going to be pretty good most of the time and you don’t want to overload the QA40x which will give you distortion.

Yeah i thought of that too, but in the mean time i think its more of problem with my circuit I want to analyze.
I checked some other circuits I made and some equipment from manufacturers and there i dont have that problem.
With my current understanding it looks like the analyzer is affecting the amplifier I’m looking at.