Effect of attenuation level on results

I’ve done an amplitude sweep on the different attenuation settings on both the QA401 and QA402, and plotted the results into Google Sheet.

The common settings are as follows:

  • Fundamental: 1 kHz
  • FFT: 32k
  • Window type: Hann
  • Sample rate: 48 kHz
  • 20 Hz - 20 kHz

The amplitude was swept in 1 dBV increments from -40 dBV to as far as it was safe to go, or as far as the generator would allow. This is in loopback mode, single ended, left channel.

THD:

Link to Sheet

THD+N:

Link to Sheet

SNR:

Link to Sheet

I did that for my own sake, but thought I would share it here in case someone finds it interesting.

1 Like

Looking at the +6 atten for both boxes e.g. it appears as if the QA401 clearly outperforms the QA402.

The QA401 definitely does well in the +6 range, especially on THD+N.

Those plots are very informative.
Thank you for taking the time to create and share them

Is there any chance that you could please do them again using these parameters?

Good idea, I’ll do that. It’s interesting to see how they compare at 192kHz sample rate as well.

Thanks, running these types of tests help to dial in the best target dBv level for your attenuation.

I made my own attenuator for the 401 and find the -6dBV is the best input level. Below that it appears that the signal becomes quite weak or the extra attenuation raises up the noise floor to far.

In my testing -11 appears to be the lowest.


1 Like

There seems to always be some variation to what level gets the best THD in my tests. Sometimes it’s -15 and other times it’s -12, on the QA401 and +6 attenuator setting. But it’s in the same area. If looking across several metrics to find the best compromise then -6 is a pretty good option.

The other problem is that the sweeps don’t allow for any averaging. It would be nice to have an option in there for averaging so multiple measurements could be taken at each level then the results maybe a bit less ambitious.

Were you able to generate a new set of plots with the higher sampling rate and fft

I haven’t had the time so far to work on the measurements.
But I’m doing a proof of concept now with support for averages during amplitude sweep. Maybe I’ll be able to use all your wanted settings.

I’ve got it working for the QA401 now.

Without any averages:

With 20 averages:

1 Like

I’ve looked more into the uneven left channel there, as it almost seems as if averaging only works for the right channel.

Another theory could be that one measurement would be far off, so the averaging isn’t able to smooth it out.

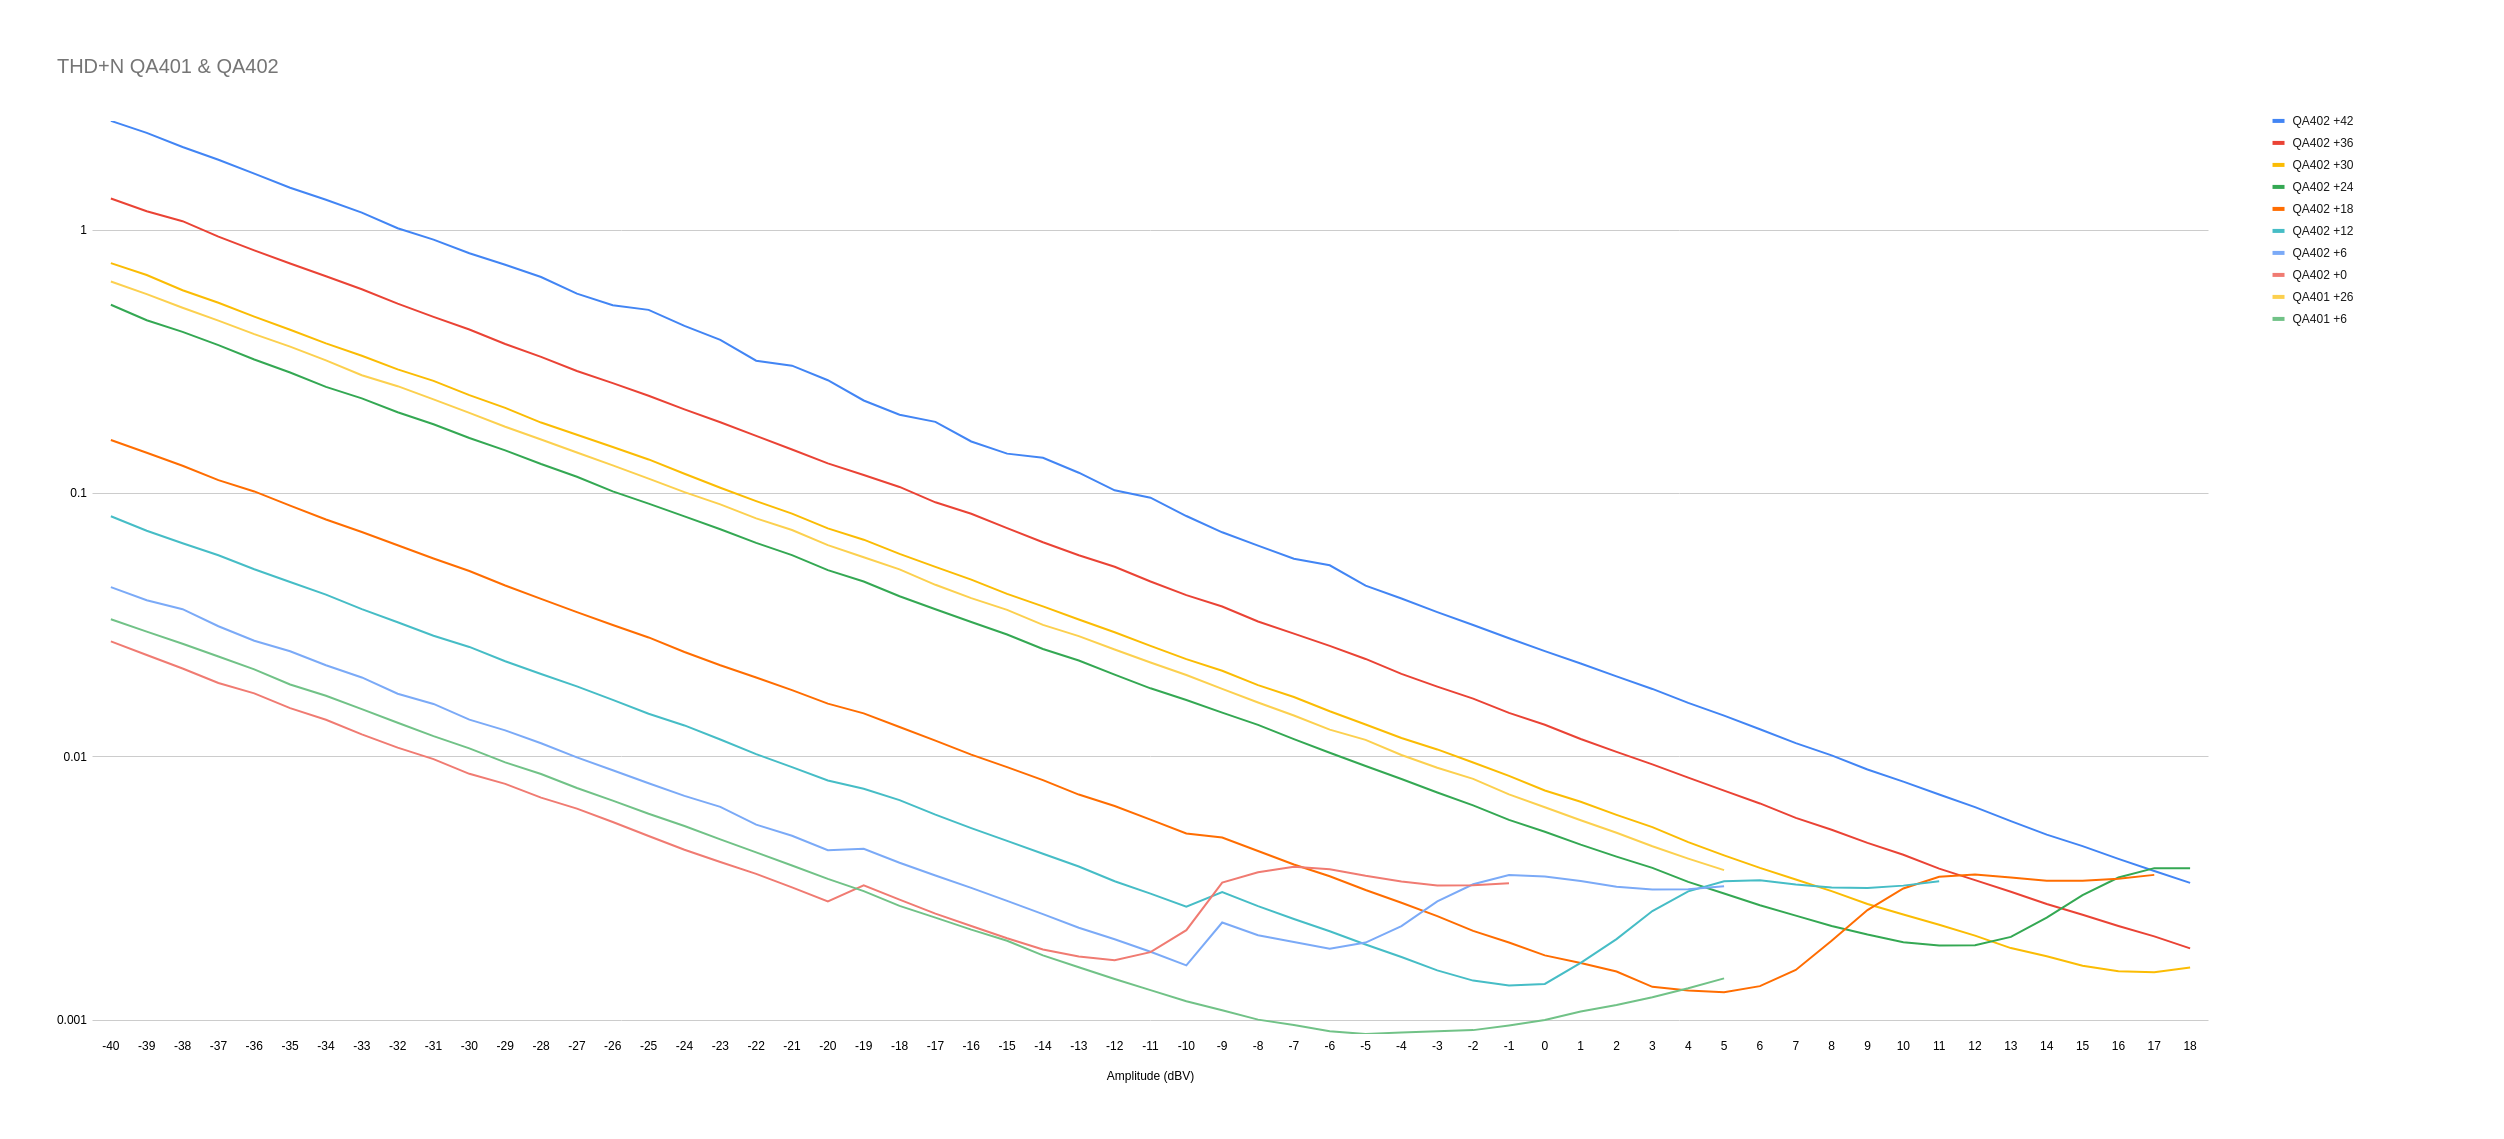
But, here is an example with 50 averages:

The spikes at -36dBV and -18dBV are still there!

With some debug logging enabled on a test with 3 averages, it seems to work like it should:

Left Avg Object { x: -37, y: -88.06942520329595 }
Left Array(3) [ -87.94052591359119, -87.86672254275254, -88.40102715354412 ]
Right Avg Object { x: -37, y: -90.59398073864186 }
Right Array(3) [ -90.80666210483946, -90.6269706075218, -90.34830950356437 ]

Left Avg Object { x: -36, y: -87.62263578484847 }
Left Array(3) [ -87.38337873782913, -87.47992063737277, -88.00460797934352 ]
Right Avg Object { x: -36, y: -91.35525708431193 }
Right Array(3) [ -91.49845889537026, -91.02222008278561, -91.54509227477995 ]

Left Avg Object { x: -35, y: -89.0486398479045 }
Left Array(3) [ -89.58806234716104, -88.36118728014819, -89.19666991640429 ]
Right Avg Object { x: -35, y: -92.78451906457178 }
Right Array(3) [ -92.82596543465581, -92.50493911178549, -93.02265264727404 ]

Left Avg Object { x: -19, y: -106.78792007020523 }
Left Array(3) [ -107.08643417960914, -106.53207577515903, -106.7452502558475 ]
Right Avg Object { x: -19, y: -108.25841335194217 }
Right Array(3) [ -108.30169760344062, -108.43563859068452, -108.03790386170135 ]

Left Avg Object { x: -18, y: -106.12511412243259 }
Left Array(3) [ -106.03637460574981, -106.22221288471206, -106.11675487683587 ]
Right Avg Object { x: -18, y: -108.92601594066468 }
Right Array(3) [ -109.30089139410013, -108.50025094770486, -108.97690548018903 ]

Left Avg Object { x: -17, y: -107.70814729384739 }
Left Array(3) [ -107.90644964817035, -107.57803366559767, -107.63995856777414 ]
Right Avg Object { x: -17, y: -109.61882139852382 }
Right Array(3) [ -109.69651387247153, -109.51514982798861, -109.64480049511131 ]

Ok, so I’m finally done with the new measurements with averages.

48 kHz measurement settings:

  • Fundamental: 1 kHz
  • FFT: 32k
  • Window type: Hann
  • Sample rate: 48 kHz
  • 20 Hz - 20 kHz
  • Averages: 20x

192 kHz measurement settings:

  • Fundamental: 1 kHz
  • FFT: 128k
  • Window type: Hann
  • Sample rate: 192 kHz
  • 20 Hz - 95.9 kHz
  • Averages: 20x

THD:

Link to sheets

THD+N

Link to sheets

SNR:

Link to sheets

1 Like

That is a lot of work- thanks for sharing!!!

1 Like