Wow & flutter visualizer

Hi, I have a QA401 so older code 1.924. I have the W&F visualizer v0.83.

I’m writing to verify this earlier version produces a valid measurement? I know it’s unweighted but the numbers I’m getting are actually better than expected. Are they real? Thanks.

Hi @Chicago, you can verify by creating a synthetic test waveform. ChatGPT is quite good at these tasks. Just ask it to create 32-bit stereo wave file of a 1 kHz carrier modulated with a 4 Hz tone at 1 percent and it should spit out the wave file (pasted below). You can then play that wave, capture it with the QA401 and see what it says. 4 Hz is important because it should read the same whether weighted or unweighted. If I had a 401 nearby I’d try it. But post what you see. Here’s the QA403 output:

1kHz_4Hz_1percent_wow_flutter_256k_float32.zip (959.7 KB)

Wow and flutter is measured at either 3kHz or 3.15kHz, with wow at 0.3Hz-6Hz and flutter 6-200Hz.

unwtd characteristics 0.5-200Hz (JIS) and CCIR/DIN 0.3-200Hz.

Not sure why anyone would be using a 1kHz centre. Most W&F meters have internal crystal controlled 3/3.15kHz precision oscillators. IIRC there’s a +/-10% (300Hz) tolerance on my standalone W&F filter for each JIS/DIN centre freq.

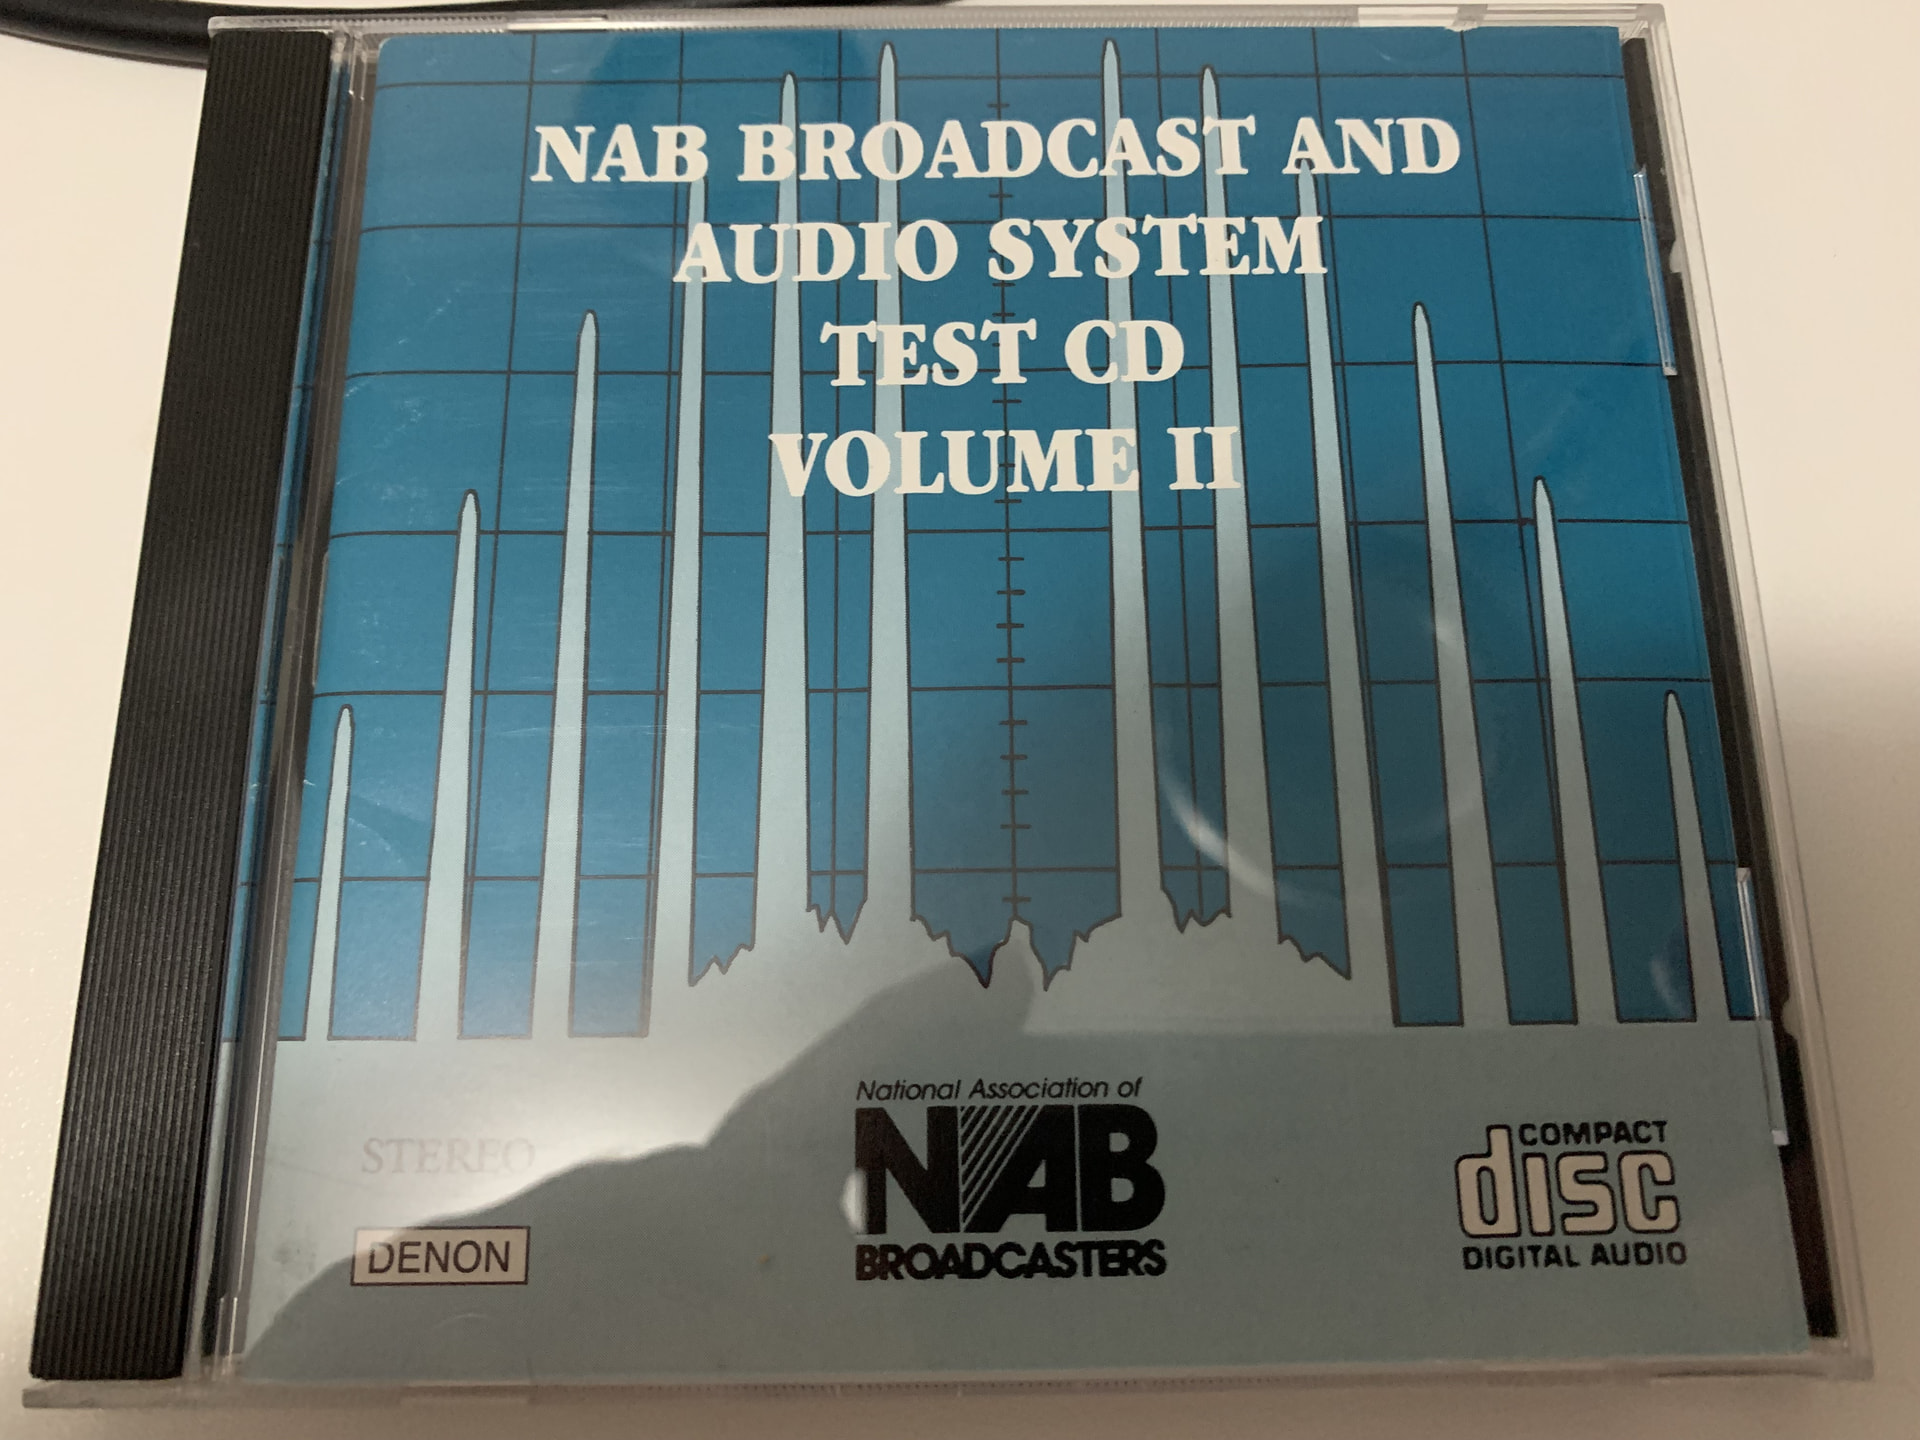
I have some NAB flutter calibration files on an industry NAB test CD which are used to calibrate flutter meters in broadcast studios. They have been confirmed to be spot on-on my meter in each of three ranges (0.1%, 0.3% and 1% FSD) with six tracks, two standards.

I haven’t played those tracks into the QA403 yet, but it will be interesting to see how the results align.

edit: As expected, the NAB tracks give correct (The 1% is out by a touch) numbers for JIS/CCIR/NAB but not for DIN. The DIN reference should be removed from the Y axis of the visualizer graph as they are not interchangeable.

1 Like

Matt I can not get your file to work. It imports into the QA401 just fine but it only runs once. I tried looping the file in VLC and sending that signal to the 401 but there is a gap in the loop process that throws things off. What am I doing wrong here? Thanks.

Hi @restorer-john, you can use just about any frequency. The old HW meters had to have a certain frequency because they were doing the detection in hardware. But in software, it can handle 1k and 3k/3.15k no problem.

The DIN reference should be removed from the Y axis of the visualizer graph as they are not interchangeable.

The right Y axis refers to the weighting curve, which I understand to be the same for each standard.

As expected, the NAB tracks give correct (The 1% is out by a touch) numbers for JIS/CCIR/NAB but not for DIN.

Interesting! DIN and CCIR should be mostly interchangeable. Both use the same weighting curve, both use quasi-peak detectors. The big diff is test freq (3k versus 3.15k).

Standard Detector type Conversion from RMS for sine modulation
JIS RMS 1x
NAB Rectified mean 2*sqrt(2)/pi = 0.9003
DIN Quasi-peak sqrt(2)
CCIR Quasi-peak sqrt(2)

So, given the above for a sine modulator, we’d expect NAB to always be lower than JIS, and JIS to always be lower than DIN/CCIR just based on the detector used. For non-sine modulators, there’s no fixed conversion.

Referring back to the original data from the synthetic test tone:

Above you can see the peak frequency deviation, followed by the weighted and unweighted RMS. Now, you can manually map these to the standards. Knowing they all use the same weighting, we could start with the weighted RMS. RMS is JIS, so I’d expect a JIS RMS detector to read 0.705% after weighting, a quasi peak would be sqrt(2) x 0.705 = 0.997%, and then NAB mean would be 0.705 x 2*sqrt(2)/pi = 0.635%. And of course, this all assumes sine modulators.

Now, of more interest today is those working on brushless motors for tape and turntable drives, where your software is responsible for a lot of the torque ripple produced by the motor. Tweaking an FOC sine-drive algo can change torque ripple a lot. And for those folks, I don’t think the old standards are that helpful. They want to see the raw spectrum, and the weighting overlay on the graph is helpful so they can see where the torque ripple products are falling.

So, just to check, did the NAB CD show around 0.634% for NAB, JIS at 0.705, and DIN/CCIR nearly 1???

Hi @Chicago

Matt I can not get your file to work. It imports into the QA401 just fine but it only runs once.

Yes, that’s correct. You are importing the wav so there’s no reason for it to loop. It’s a one-shot deal.

I will run the 3 tests for the two standards on the disc on both my Kenwood FL-140 W&F meter and the same on the QA403 W&F visualizer and post the results. I had a discussion with the MI (multi instrument) developers a few years back where they used my NAB files to add a weighting and confirm it on their software. (somewhere on ASR)

I have the 6 files sitting on my google drive if you want a link for testing or potential evaluation purposes.Cheers, John

Hi @restorer-john, yes, if you could share a wav that’d be very helpful. With some coaxing, the various AIs can also inhale the WAV files, tell you the depth of modulation, demod, plot the spectrum, make beautiful plots of the data…

Hi @restorer-john, thanks for the files. I asked AI to resample all to 48k, analyze with python and that yields:

Note that for DIN, it is the peak %, whereas with NAB-JIS it’s the RMS %.

Loading the 3.15k DIN 1.0 into the QA403, I get the following. Note the peak dev is 1%, RMS is ~0.707%, agreeing well with the py. So, a JIS meter should read this file as 0.707% while a NAB meter would read this file as 1.0%

One point these files you shared make clear is that NAB does use an average responding detector, but they appear to RMS calibrate it. And so, for NAB or JIS, you’d take the RMS deviation. And for DIN you’d take the peak deviation. IOW, the files make it clear that NAB and JIS are both RMS and thus will agree for sine modulators.

1 Like

Clearly that is all they (those crusty old NAB dudes) ever considered as a variable because it was, after all, an analogue system. They didn’t consider anything other than mechanical tape path issues.

I really don’t know what is the best (for genuine W&F audibility) test or actual standard out there. DIN, JIS, EIA, CCIR etc. Is there a consensus? WTD/UNWTD, Peak/RMS? An apples to apples test. My meter (weightings) can tell me anything, but which/what is the gold standard?

I confirm JIS for cassette decks and Japanese TTs and peak (DIN) for EU stuff, but Pk is seriously difficult on analogue gear and involves a whole lot of human eye/brain integration on the meters.

I really don’t know what is the best (for genuine W&F audibility) test or actual standard out there.

Hi @restorer-john, that must be why so many standards exist! As the old saying goes “The nice thing about standards is that there are so many to choose from.” or something like that. :slight_smile:

I think when looking at a device with several contributors (capstan eccentricity, torque ripple from the drive motor, pulley eccentricity), the RMS is the best way to capture them all together. And then look at weighted versus unweighted. And if I were doing development work on a modern transport, I’d probably be locked on to the spectrum.