For most of what I do, 20-20kHz Frequency Response measurements and SNR/THD/Gain at 1kHz are sufficient. I decided to “branch out” a bit and use the AMP THD vs frequency automated test so I could compare some similar data taken on a receiver I am testing. The receiver’s FR and 1kHz look spot on per the old data, but the THD vs frequency does not using the automated test. Here is the response for 1kHz at 5w/8ohms:
And here is what I got using the automated test (I did try a larger FFT here, but it did not change from the 64K FFT). I am sure I am missing something simple with my automated test methodology that someone can point out. Even at 1kHz the THD from the automated plot is off by an order of magnitude, not that anyone can hear it…(The spec on the unit is 0.015% THD at 50w/8ohms 20-20kHz)Thanks for any assistance.
That can’t be that big a change. Is autoset input range on? What did you put for offset amount? Is that your difference?
Default is 18 and that looks about your difference if I’m reading it correctly.
I turned the autoset off as I was checking only two ranges that were ok with the attenuator setting that I was using. I have not had good luck with the autoset when I had tried a similar measurement in the past. I did not have any problems with the 0dBv input at 1khz with the attenuator setting I used and since the amp is very flat so it should not run into overload at other frequencies…? Thanks for the help again
I am not sure why it is only plotting to 8kHz. For the 0dBv input at 1kHz the plot below shows a THD of 0.005% for the left channel vs ~0.015% for the automated test. I did not try to verify the low frequency results, but they should be better than the 0.4% that is showing on the automated test.
I might be completely off base but re 8k, you have 3 points per octave. That would put the next point in the octave above 8k higher than 10k and that is of course beyond the limit for a thd test ending at 20k.
On the thd at 1k, when you do the automated test and its at the 0db gen output level, what is the input atten level. Is it the same as the -36db level that you show in the individual 1k measurement in the last pic above?
If you do individual 1 k tests at -5 and -10db input are they off by the same amount from their automated test counterparts?
Just tested the points per octave and that is the issue. Increase the points to 10 or 15 and you will get close to the 10k mark on the graph.
Try Hann and not Rectangular on the windowing and see if there is the same difference in thd.
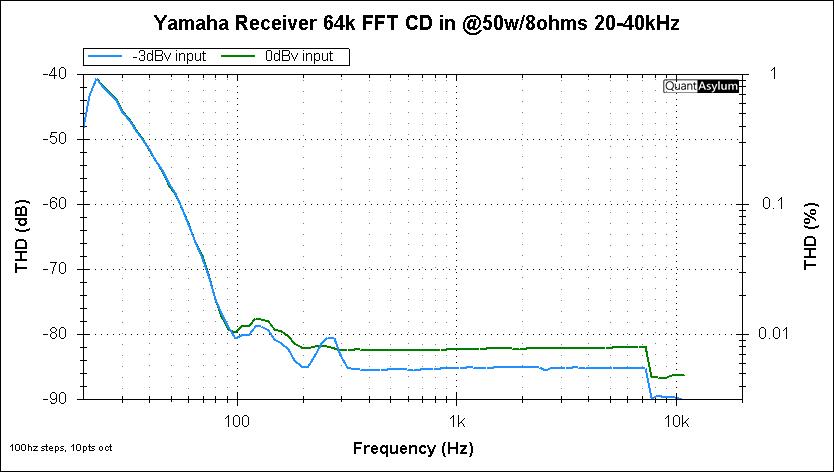
Moto- I really want to get to 20kHz, and I will try a wider band (20Hz-40kHz), and increase the points per octave. I usually get lower thd with rectangular, but will try Hann. I am retired and have time to try different things. I did not care about checking the other two input levels as the data I have (from a1996 Audio magazine ) just specs THD for a single power level (50w/8ohms), so I set my amp to give me that with 0dBv at 1kHz (the receiver has about a 0.5db flatness across the band). I will start of at -3dBv and do one step to 0dBv and keep the uncheck the input range adder and see what happens. Will report back and thanks!
Sounds good. The reason I asked about whether the -5 and -10 automated test thd values at 1kHz differed from a stand alone 1kHz test thd is because I think the difference you saw on the 0db sweep has to do with the input attenuators although I’m not sure why. When I run a sweep vs a standalone thd test, the values match.
So I did some more variations and I think there may be a problem getting the whole 20-20kHz band when you uncheck the “Measure THD+N instead of THD”. Here are the settings followed by the plot:
The good thing is that the THD (for the left channel) agrees closely between the two plots (~0.008%) But we are only going to 10kHz. I am ignoring the results from <100Hz for now.
When I keep all the the same settings except that I check the “Measure THD+N instead of THD”, here is the resulting plot:
Not sure but interestingly the 1k thd on your bottom graph matches your stand alone 1k thd measurement, -82db.
It must have to do with ranges over which distortion and noise are actually being counted but I need to noodle that.
What was the range over which the data on the bottom graph were measured?
They were all measured with the attenuator set at 36dB. Yes, the THD % results match up the same for either of the cases at 1kHz. I did increase the FFT to 128k and got a bit improved low frequency response, but still not close to the spec:
Not sure about the jump for 0dBv at 20Hz, but can live with it for now, but once again, the full range is not plotted. IF I check the “Measure THD+N instead of THD” box and re-run it, I will get data to 20kHz:
I guess the test works best with HANN windowing. But it looks like there may be a problem when you uncheck the “Measure THD+N instead of THD” box…Maybe Matt can chime in?
Good point. I will try it one more time and set the measurement window from 10Hz to 50kHz, and just plot 20-20kHz, and maybe allow for a 6dB attenuation…But 1st I am off on a 22mile bike ride before it gets too warm…
OK, so I have got some more data- not sure what is going on, but here it goes. Here is just the left channel’s thd/snr plot at 1kHz which shows ~0.008% at 50w.
The measurement stops at 10khz once again My reading of the 0dBv graph at 1kHz is about 0.023- not as good as the plot above but it and the low frequ data is good enough for government work as they say. One final piece of this puzzle is the following plot for THD/SNR at 20kHz for the same 5hz-50khz span. It is showing the power level to be 11.3w instead of something near 50w- the dBr value was set at 1khz and the 20khz reading is only 0.26dB less than that. The 2nd harmonic at 40khz is 90dB down so there should be some none zero value of THD displayed, I would think.
I only truncate the lower frequencies when setting up the plot axes- the stopping at 10kHz happens “automatically” except if you check the “measure THD+N” box…