Releases for new SW are posted on github (see here for the QA402, for example). The 0.996 release for the QA402 adds a some more features, including:
- Export multitone WAV
- Multitone generation
- AMP Frequency Response Chirp plugin
- User weighting
- Triggered Captures (aka Open Loop)
Export Multitone WAV
Multitone testing is an useful technique for testing amplifier linearity. When amplifier suffers from a non-linearity, it will manifest as a mixing product. That is, you subject the amp to two tones, and additional “phantom” tones will be created from nothing. There are formal IMD tests (see SMPTE and CCITT). Multitone tests take those a step further, subjecting an amp to dozens or even hundreds of tones simultaneously.
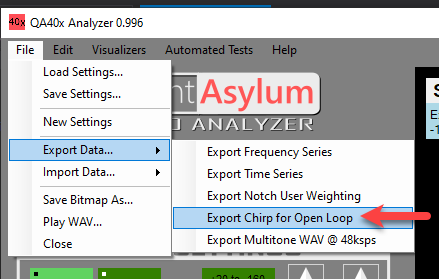
In the 0.996 release, you can create a multtone WAV at a 48K sample rate using the File->Export->Export Multitone WAV @ 48ksps. The options for the export as follows:

Be aware the RMS you specify is the average RMS–the peak will obviously be much higher. If you are generating two sine wave of different frequencies, and the amplitude of each is 1.0, then the maximum peak could be 2.0. And if you are generating 50 tones each with an amplitude of 1.0, then the maximum peak could be 50. As you specify more tones, the total RMS may need to be reduced.
You can also specify you’d like the generated tones to be nudged slightly to land in FFT bin centers, allowing you to use a rectangular window. The generated WAV can be played on whatever device you wish.
Multitone Generation
For the multitone generation out of the QA402, you select the multitone generator:

Right click on the button to bring up the context menu and set your parameters:

And the resulting spectrum in loopback (HANN window) appears as follows:
Note that the measured RMS appears as -25 dBV, the same that was specified in the setup. But the level of each tone is around -42 dBV or so.
AMP Frequency Response Chirp Plugin
The AMP Frequency Response Chirp Plugin allows you to quickly characterize the frequency response of a DUT in under a second. This is in contrast to stepping tones sequentially through the DUT and measuring the response of each. The setup for the plugin is shown below. The settings resemble the setting available in the Expo Chirp context menu:

Below is a sweep of a bandpass filter and several different smoothing options:
User Weighting
User weighting functions just as it does on the QA401. This allows you to apply a curve to the measured data. Some common scenarios include:
-
If you are working on a phono preamp, you can use the anti-response to “flatten” the curve of your circuit. Thus, ensuring your response is correct is simply a matter of ensuring the response is flat.
-
If you are facing some mains noise in your circuit you’d like to reject, you can build a custom weighting curve that notches out the response at the offending frequencies.
-
Mic curves can be applied in the user weighting, ensuring the overall response is flat.
There is a fixed curve for A-weighting, and user-defined curves for RIAA record and playback, and you can create your own weightings as needed. Below is multitone in loopback with the RIAA Record Response applied.
Triggered Captures
Triggered captures builds on the QA401 functionality. The common industry name for this feature is often “open loop” testing. But in a nutshell, this mode allows the analyzer to measure an external signal where the measurement start time is triggered by an external event, which is usually embedded in the stimulus itself.
If you are aiming to measure a constant sine wave or noise, then you don’t need a trigger. The signal is omnipresent and you can capture it whenever, analyze it, and repeat as often as you like.
But what if you have a device without any analog inputs and you want to measure a swept tone to learn the frequency response of a DUT quickly? For example, how can you learn the response of an MP3 player which has no inputs?
In release 0.996, there are two pieces added to enable these triggered measurements. The first is an exporter to build the special chirp. The second piece is the ability to wait for a trigger before starting an acquisition.
As an example, let’s say we want to measure the EQ in the Windows 10 Groove Music player. That is, we’d like to learn see what the EQ is doing when we adjust it as follows:

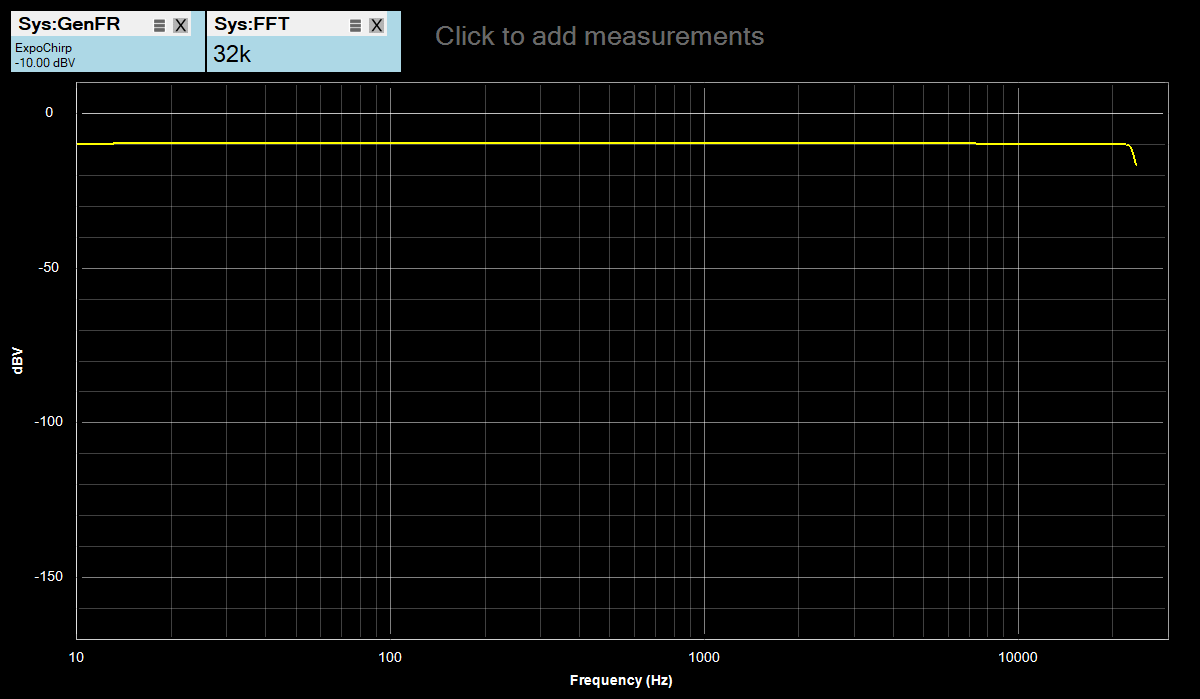
To measure the impact of the frequency response, let’s use an exponential sweep as a stimulus. First, we can decide the size of the FFT we want to use. Usually longer is better, but that might not always be practical. To understand the tradeoffs, first make some Expo Chirp measurements in loopback mode to learn how the FFT impacts your measurements at the band edges and to understand how windowing plays a role. For the sweep below, we started with File->New, and then set Expo Chirp, changed the level to -10 dBV, switched to rectangular windowing, disabled the right channel, switched to +6 dBV input, adjusted the FFT size to 32k and set the X axis to range from 10 to 30k. The response looks as expected for the 48K sample rate.
Next let’s export a chirp with a 32k FFT size.

The default parameters are fine:

The default export file name is fine. Embedded in this file name is the Bit Depth (32-bit float), the required FFT length (32K), the pre-buffer size, and the amplitude (-10 dBFS).
Chirp_Bd32f_Fs48_Le32k_Pb2k_Am-10.0dBFS.wav
Opening the WAV in a wave editor such as Audacity shows the following. Note there are 4 distinct regions. The first is a region A with a greatly elevated noise floor. This is to ensure any noise gates on the DUT are opened. Region B shows the trigger burst, region C is a brief pause of 50 mS before the chirp, and region D is the chirp itself.
Next, let’s load the WAV we just created into Groove Music Player and verify the EQ is flat:

Right click on the Run/Stop button in the QA40x application to open the context menu. On the Triggered Acquisition page, click the start button to start acquiring samples from the DAC that Groove Music is using:

At this point, you’ll see a fluctuating level being reported in the progress bar. Note the trigger level has a default of -25 dBV. Whenever the captured signal exceeds -25 dBV, the acquisition will start and you’ll know this has happened because you’ll see a “Triggered” message followed by an display update. Next, play the WAV we loaded previously: The output shows as:
Switch to Time domain and look at the analyzer input. You should see a captured sweep (without the trigger burst we saw in the imported WAV). Note that the amplitude is constant over the duration of the burst, which means the frequency response will also be flat.
Next, let’s nudge the music player EQ midrange down 12 dB:

And now re-capture the same WAV:
Next, let’s switch the plot to dBR, and select the “display peak” as the 0 dB reference point. We can also change the scale of the plot to make the responses clearer:
And from this plot, we can see the center frequency of the mid EQ is 1 kHz, and that the depth of the notch is about 13 dB with some sidelobes that are likely indicative of a less-intensive algorithm used by the Groove Music player.
The exponential swept chirp is a very quick way to characterize the frequency response of a DUT.
Summary
Feel free to post any questions, bugs or observations here while using the 0.996 release.


