The files are standard zip files. In Windows I use 7-zip to open them and inside is a single file (with a plt suffix). That file is a standard JSON-encoded text file that’s human readable.
In Linux you can just double-click it in the file browser and it will extract the single file contents.
The windows File Explorer, surprisingly, doesn’t seem to just open the file. I’m not sure why that is but it says it’s invalid - I’ll look into that since it should be just stock windows-compatible.
Mark
P.S. - oh whoops. I took the ‘how to write a zip file in C#’ from a very popular post on stackoverflow and apparently that’s a gzip file not a zip file. I’ll fix that since I’d like it native windows compatible. Thanks for noticing. You’re the first person to notice in almost a year (including me).
note that QA40xPlot can load the uncompressed text files as well as zips
I’m just about to update the Amplitude sweep pretty substantially (another day or so of testing). Most of the changes are invisible other than a few more output statistics and support for multiple frequencies. Expect the test file format to change with this release. Look at ArrayToColumn in ActOpamp.cs for a dictionary of raw→values and note that the steps list shows the frequency decisions for the sweep while potentially the X list cycles through the amp list repeatedly.
I have not done audio analysis in over 40 years (I am now 76). Just got QA403 which is incredible. However, I was pretty disappointed with the native SW, but your app is excellent. Thanks so much for this. Makes the QA into the amazing tool that it can be.
Quick question to start: I noticed that one of the tests apparently can use a .wav file as the test source. Is this feature active? If so, where do I put the .wav file(s)? This feature would serve me very well. I would be happy to test.
Click the little eighth note button and up will come a file browser that lets you browse to find the wav file. The WAV file is opened, the wave is resampled to your FFT sample rate, then it is padded (with quiet) or truncated to fit the FFT size bucket, finally it is used as the source each repetition.
If you want to check that everything is working, this is also supported in the Scope test so you can see the actual waveform being used in Spectrum.
Mark
short answer: the file can come from anywhere on your PC
In Util.cs there’s a method SaveToFile that saves time and or frequency data into the file by calling FromSeries on the binary (double) data. This converts the data into DF (the frequency delta) and Left and Right. Left and Right are built by calling ConvertUtil.CvtFromArray which does→
copy all of the doubles to a long array of bytes then do a Base64 conversion.
Because I then compress all of the text data this ends up being a pretty small file.
If you look at ToSeries it does this in reverse by calling CvtToArray to load the data.
The frequency data that is saved is, as I recall, the averaged FFT result.
Mark
I did a little more looking, and the frequency results (named FreqSaver) only happen if the number of averages > 1 otherwise it just saves the time data (TimeSaver) since the fft can be easily recalculated on load.
MarkZ:
Feature request: It would be useful if there was a way to generate a continuous sine output, perhaps similar to the QuantAsylum GUI Idle mode. The reason for this is that I have several amplifiers having internal adjustments that require making AC measurements with a continuous sine input.
Version 1.2.3 just shipped. This is an important upgrade for that project I’m working on with Matt but relatively minor otherwise. The biggest change is that the Amplitude sweep now lets you provide a list of frequencies and it will then do multiple sweeps. Other changes are mainly cosmetic and minor bug fixes.
Under the hood are a bunch of changes so this was tested longer than usual. Hopefully I caught everything.
Mark
By the way, that photo above was testing a phono preamp so having the magnitude lines be flat from 0.1 to 1 volt shows how well the gain calculations are working. Here’s the magnitude plot for the frequency sweep. Setting output voltage ensures that maximum voltage is == the setting.
When you run the program it will automatically update. You don’t have to do anything. The code in the repository is manually updated by me when I do updates so that now has the 1.2.3 updates.
It would be useful if the Spectrum window had the option to display the residual in a small window.
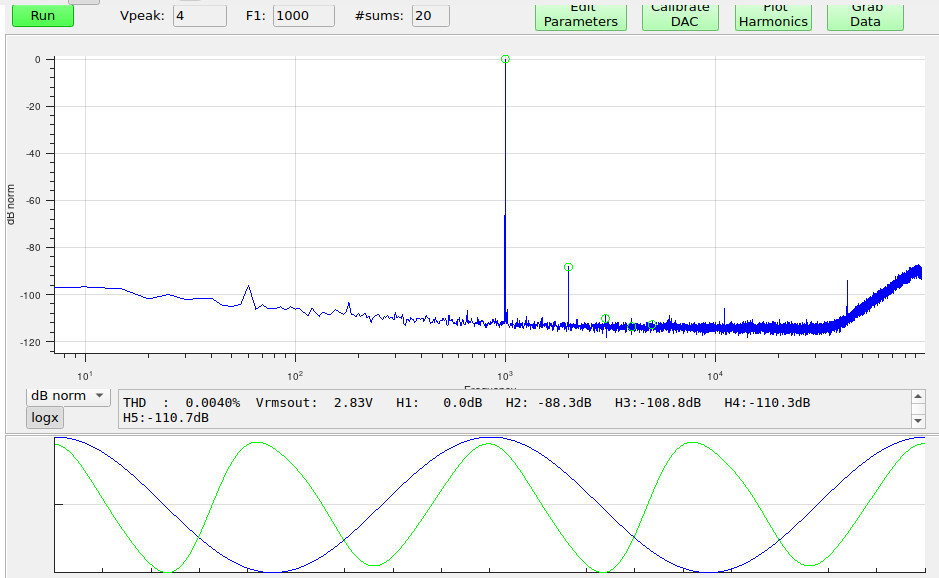
Below is an image from my GNU Octave based spectrum analyzer showing the fundamental in blue and the sum of the first 4 harmonics (H2 + H3 + H4 + H5) in green.
The computation is very simple but requires both the magnitude and phase of each harmonic (or equivalently the corresponding complex value).
The residual is informative about the cause of distortion - for instance if you look at the residual you can quickly see if there’s any cross-over or clipping component, and judge the level of noise too…. If you have distortion you want to reduce, the residual is going to help characterize it.
Is there any document you can point me at about this? I don’t really see how having an arithmetic sum of distortions helps with these questions but I haven’t looked into it. I’ve never noticed it in REW, is it there or in something else I can find doc for?
1 - Where can I find the version # when I am running the sw?
2 - I am running tests at microphone levels and want to specify in dBV. Depending on the test I am running, when I specify dBv for the generator, the dropdown menu choices seem inconsistent: sometimes they are in mv, sometimes in dBv. Inconsistent between tests, and even between the two generators, for example, in Scope mode. I know I can type into the input box, but it still doesn’t look very clear. Also the fact that the box always displays “Voltage” is confusing when dBv is selected.
3 - Is there a way to specify dBv as my default value for the generator (and levels in general) system-wide?
4 - The Summary display is excellent for all of the info. Still, I would like to see the ability to have large, selectable display windows overlays on the graph for things like Generator (freq and level, in my choice of uints), THD, SINAD, Input level, etc. The native QA SW allows this and is essential for my work. Any chance to add something like this? I can provide screen shots and/or mockups of what I would like to see, but i think that the native QA sw has this feature if I am not mistaken.
5 - Is it possible to add the ability to start and stop a test with the space bar or some other key. Using the mouse is tedious.
I no longer run the native sw, as yours is 1000% better, and I know you have a lot on your plate, but I thought I would provide this feedback. Thanks so much for your consideration.