The QA401 works today by generating a stimulus, which you can pass through a DUT, and then measure what is recovered. It also works if you have an external source for the stimulus as long as that source is a constant tone. The PC Mirror mode allows you generate stepped tones on a PC, allowing the testing of DAC frequency response, for example.
But as far as testing a device that isn’t under the control of the same PC that is controlling the QA401, that hasn’t been possible to date unless the source was a constant tone. In the industry, this is generally referred to as “open loop testing.” And it’s also important on sources that might not have any inputs, such as a car stereo.
Release 1.920 adds the ability to do open loop testing. There are two pieces to the testing. The first is generating a reference WAV. This is the WAV you’ll move to the DUT. For example, if you are going to test a car, then you’d put the WAV on a USB drive, insert that drive into the car, and play the WAV that way. Or, the WAV could live someplace in the cloud.
The WAV generated by the QA401 application depends on the sample rate, amplitude and FFT size you are working with. So early on in the test you should pick those parameters that are suitable for your needs. For the example, we’re at 48K sample rate, and let’s set our FFT size to 128K. That can be done by using the up/down control to adjust the settings.

The adjustment is shown in the upper left of the spectrum display area:

The WAV file generated will be in the units dBFS, referenced to a +/-1.0 full scale. To select the amplitude, go into the FR context menu (control + click on the Freq Response button in the MEASUREMENTS group) and set the stimulus to ExpoChirp and the amplitude to -1 dBFS.

With the amplitude and FFT size set, you can then export the special WAV file. To do that, go to the File -> Export Data -> Export Chirp

The exported file is place in the QA401 directory (\Documents\QuantAsylum\QA401).
The generated file might look something as follows:
Chirp_Bd32f_Fs48_Le128k_Pb2k_Am-1.0dBFS.wav
This is an exponential chirp, with a 32-bit floating point depth, at a sample frequency of 48K, suitable for an FFT length of 128K, and a pre-buf of 2048 samples with an amplitude of -1 dBFS. These are probably all clear except for the pre-buf. In short, the pre-buf is the amount of buffer used before the FFT. On devices with very low latency, the minimum pre-buf can be used. On devices with a lot of latency, such as bluetooth speakers, then you’d want to use more latency. The user’s manual covers this in more detail.
With the file generated, let’s open the WAV in Audacity:

Overall, it looks like a typical chirp. But let’s look at the beginning in more detail:

What we see here is 10 cycles of 1 kHz, followed by 30 mS of silence, followed by the start of the sweep. Measuring the first cycle of sine after the 1 kHz chirp shows 50 mS, which corresponds to a 20 Hz starting frequency. The 10 cycles of 1 kHz is used to trigger the measurement. It will be removed before the analysis is done on the captured sweep.
Because we’re running a sweep and interested in looking at the frequency response of the DUT, make you are in the Frequency Response measurement mode.

There is a new button in the UI, marked Open Loop Acq. This button can only be pressed when the analyzer is stopped.

Pushing the new button reveals the following dialog:

Note there are two controls in the dialog. The upper is a bar graph that will show the measured peak dBFS in real time. This updates about 4 times per second. If you are using a mic, then the level will be much higher.
You also can adjust the threshold that will initiate the trigger.
Once you are in this state, it’s time to start playing the WAV on the DUT. If the received level from the chirp is below the trigger, then you will need to either increase the playback level of the DUT or reduce the trigger level.
When the trigger is met with the 1 kHz tone at the beginning of the sweep, the dialog will automatically close, the waveform will be captured, and the measured frequency response will be shown.
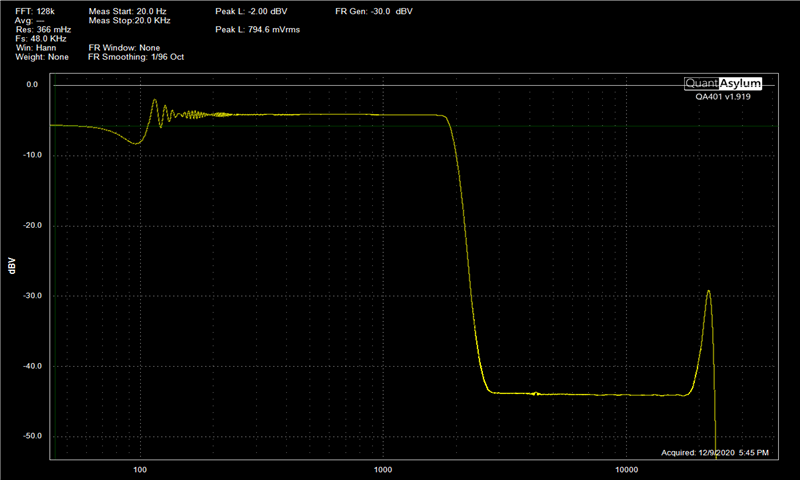
A frequency response plot of a DAC is shown below. The WAV was played on Windows 10 Groove Music player.

The “ringing” seen around 100 Hz is being looked at and will be addressed in a near-term release. But overall the measured response beyond 200 Hz is flat.
We can switch to the time domain and see what was captured. Overall it appears as expected:

Finally, let’s measure the output of a powered 2-way speaker. No gating is used here, as this was a quick measurement with a nearfield mic placement. The green trace represents the 5" woofer, the yellow is the dome tweeter.

As a final sanity check, let’s go back to a direct measurement of the PC’s USB DAC with the EQ settings modified in the Groove player:

The captured data shows a fairly narrow notch at 1 kHz with some side lobes.

A treble boost profile:

And the resulting spectrum:

Switch to Audacity again and using the graphic EQ setting:

This gives the following. Note the 40dB cut (the filter was applied twice). In short, the Audacity filter appears a bit more rigorous than the Groove filter.
Looking at a single section of the Audacity EQ gives:

And the corresponding response:


