Thoughts?
")
Thoughts?
Way too many assumptions made in that video.
Why would he think a PC soundcard had a flat spectral noise density across its bandwidth? they simply don’t as they all use noise shaping and onboard PC soundcards can range from decent to terrible in that regard.
Why would he default to ‘max out’ on all the Windows settings in the PC sound controls without first testing for maximum performance on the particular soundcard used? They are all over the place. For instance 98% (windows volume slider) on a Focusrite 2i2 v2 is perfect. At 100% the noise skyrockets.
This is a noise in the presence of signal test- Not a signal to noise ratio. They are different. S/N is conducted with a shorted input measurement vs a full level signal measurement.
There is also the issue of both the signals in the DAC and ADC modulating the noise floor of each other.
Where is his shorted input measurement test?
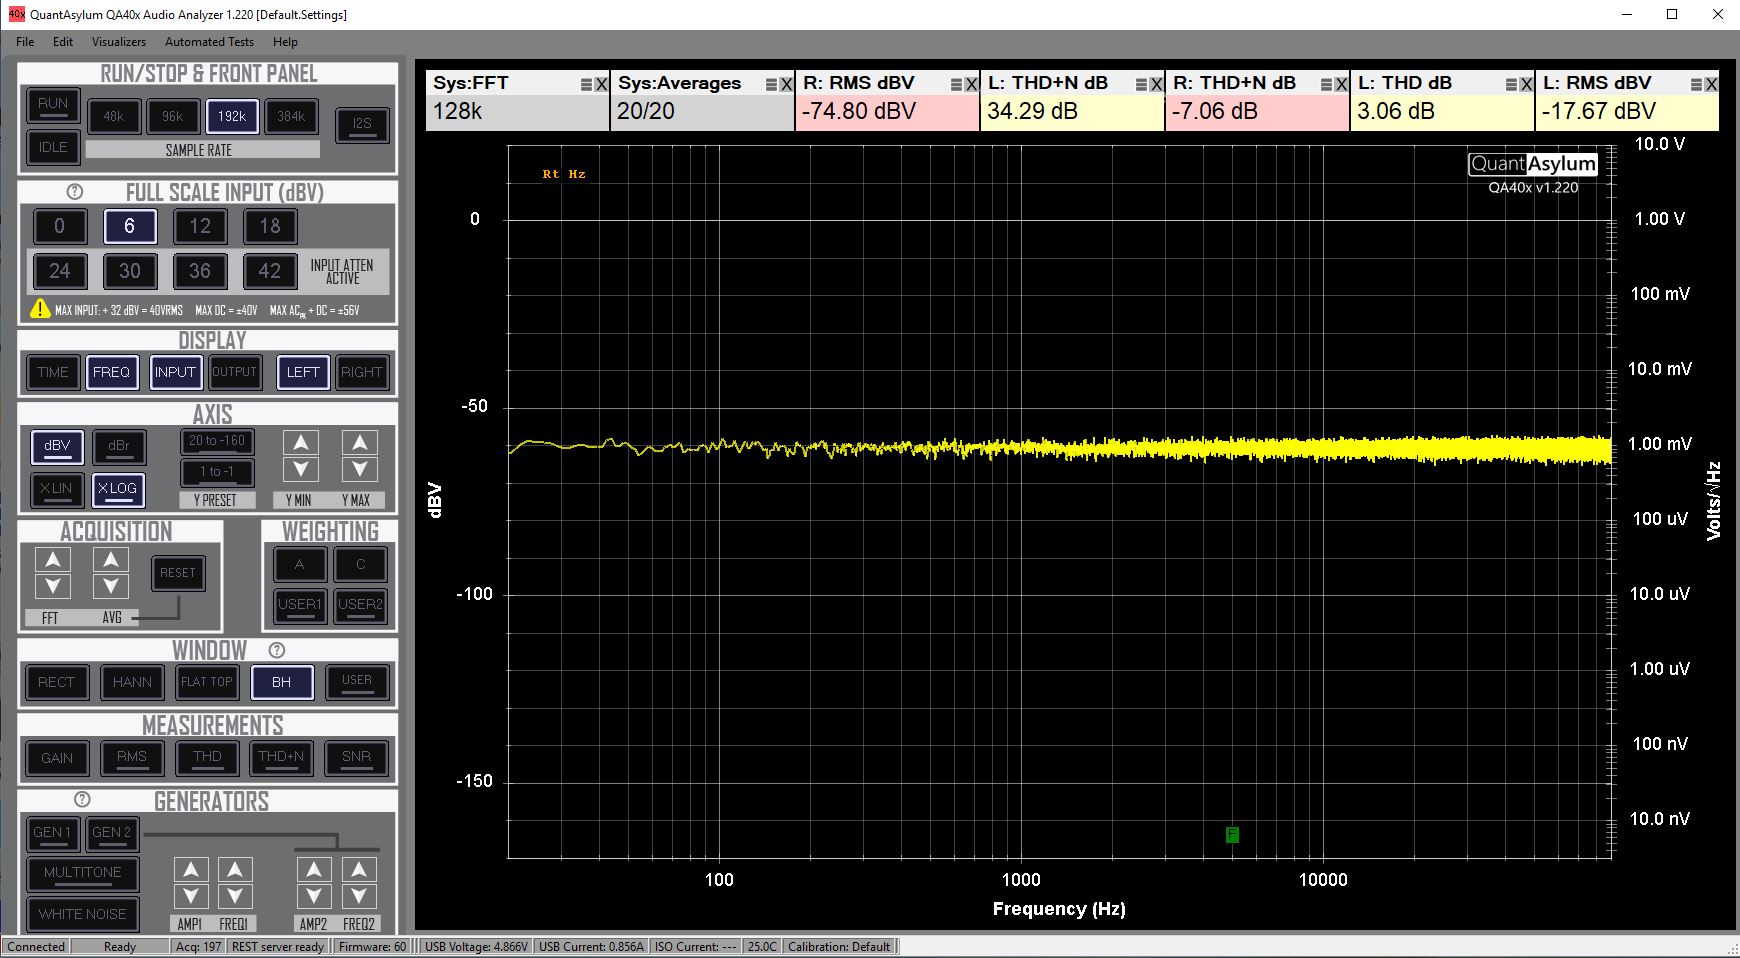
Why is he measuring noise floor on the 12dBV input scale instead of the most sensitive range? The shorted input noise floor of the QA403 (20-20k) is ~1.2uV (0dBV), ~1.9uV(6dBV) and 3.5uV (12dBV) all at 96k FS/128k FFT. The QA is also remarkably similar (for a given input range) across all its official sampling rates for noise.
He says “even with averaging it’s hard to read the noise floor”. How about increasing the sample rate and the FFT size? He’s got a 16k FFT and a 48kHz FS. That results in 3x the calculated noise level in V across the same BW.
The whole video is a mess with a clickbait (typical Youtube) title like all his others. “fails” “scammed” “busted” “never trust”… yawn.
Anyway, @peppermint You posted this video with a simple “thoughts?”. Most forums discourage posting links to dubious Youtube videos without adding something useful. Let’s hear your opinion on the video and its contents.
You’re absolutely right and apologies for that. The video left me a bit confused, so I thought I’d ask here without mentioning what I believe or steering the thread in a biased direction, if that makes sense.
That’s perfectly fair ![]()
If you want to see another cluster f… of a video, watch the “critical resistor pitfall” one. Completely missed VCR (voltage co-efficent of resistance) and went down a path of heating that didn’t apply to large wirewound load resistors.
More click bait thumbnails from this guy.
A lot of noise but superficial explanation of noise. And measuring noise to that resolution strikes me as BS. Noise is noisy. And digitally generated noise is suspect, honestly. Adding a signal to measure SNR with limitations is an interesting exercize. However as the math shows its a lot of stuff to sort out.
On the QA401 the noise density is correct only on a rectangular window. The QA403 corrected that issue. You need to account for the band edge slopes when measuring noise. And checking the specturm is not enough, you also need to check the amplitude distribution. Conceiveably the random number generator he used is really random but maybe not?
In my experiece getting noise measurements within 1 dB is really good or bogus (something is not as it should be).
I would start with an analog noise generator for a project like this. GR or Quan-Tech. They are well characterized and real noise.
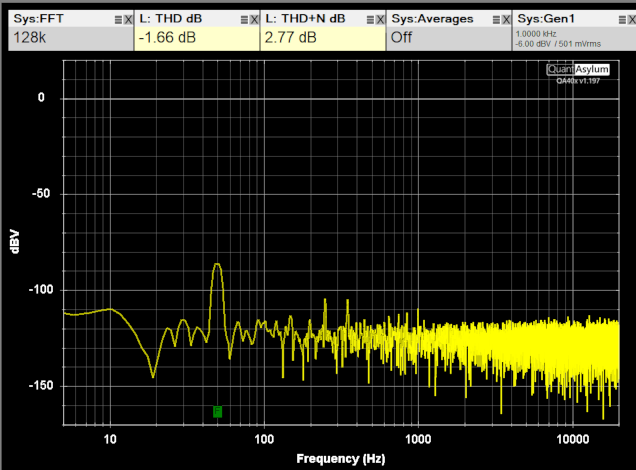
Below is a Quan-Tech 420 noise generator at 1000uV/rtHz (1 mV/rtHz) into the QA403. I get the same from my Wavetek FFT analyzer. measuring to 1 dB is barely manageable. Claiming something closer to 0.1 dB seems ludicrous.
If anyone wants a recording of real noise (192/24) let me know.
That Quan-Tech is 56 years old! Awesome.
Have you run the (192/24) recording of its output into the QA-403? How different is it to direct connection? I guess at 1mV, the noise is far enough down.
Erm, I disagree on both points, if you sample for long enough you can measure noise to any precision, this is basic statistics after all. Digitally generated noise is precise and stable compared to the alternatives.
How can noise be precise if its noise? Digitally generated noise comes from some number sequence. How random is that sequence? Where does it come from? Pseudorandom is useful for many things but it repeats. Real nise doesn’t have precise bounds. Below is 100 averages of the noise generator. While you can eyeball numbers they are an approxamation. If you measure the full band with a long average you see it still flucuate.
You mistake precise for exact - in real life nothing is exact, but it can have a precision, such as +/- 0.001mm for a micrometer reading, and noise can be measured to arbitrary levels of precision if you wait long enough, just like anything statistical. 4 times more measurements and you have twice the precision with any Gaussian distributed noise for instance. So a million times more measurement data improves accuracy by a thousand-fold (assuming the source is that stable to start with).
Non-coherent light (from a tungsten light bulb rather than a laser) works just like noise - you’d have no trouble imagining measuring the brightness of the bulb to high precision, yet you are just measuring a statistical random stream of non-corellated photons, i.e. noise.
The plot above is zoomed into to a few dB - average 10000 times and it will get 10 times flatter, a million times and 100 times flatter. Here’s a more standard 10dB/div scaling with no averaging, 10 times, and 100 times:
There is a bug that was uncovered in HansR’s testing related to averaging that did require his synthetic test to make it easier to see. The subtlety is this: When you are averaging, you need to average the power and not the amplitude. The upshot is that if you are averaging on the amplitude alone, you will your results for SNR and THDN will be about 0.2 to 0.5 dB better than they should be. This should be fixed in 1.221 released HERE.