Hi Matt,
Thanks for the reply !
In fact , I thought a bit about what could be “easely” done !
I wasn’t talking about modifying old stuff ![]()
However there is , I believe a wonderful “magic” trick that could be done : Your current software , which I can run on my old contraption (which is actually a quite old Mac Book pro twisted into a boot camp windows machine !)
Accepts csv files that it then displays ? Graphs in a very nice way No ?
If only it could read / convert the two or three file format that came out of my QA 400 , it would become more like a QA4000! ![]()
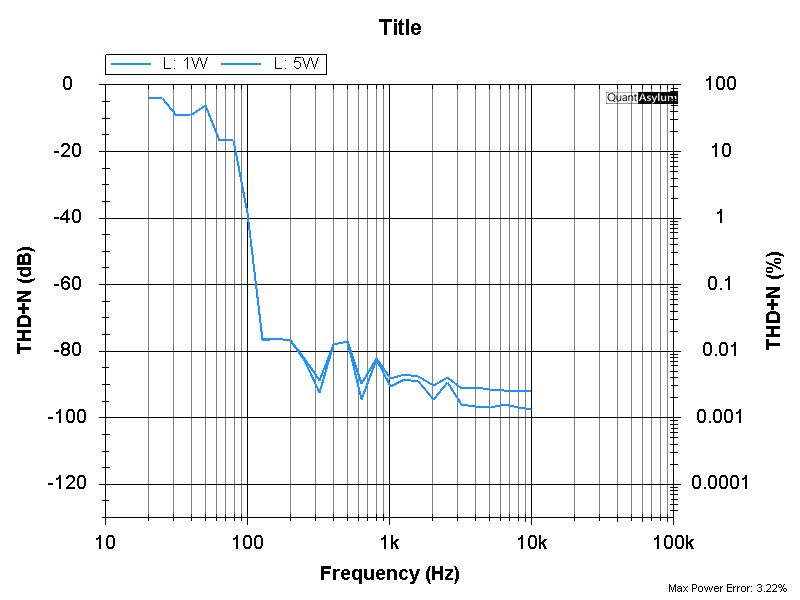
My grind is in particular with THD / FreQ csv files , eventually Amplitude vs Phase files, but as said I can get easy results from my DSO on that !
(Were they any other ? I think they are only three types of csv files no ?)
All that is needed is I believe some reformatting the csv ? before being fed to your current up to date software to display and make quick use of those old data formatted csv !?
It would rejuvenate completely what can currently be still done with a 400 ![]()
I imagine, maybe wrongly, that for the developer that wrote the current “graphing” routine could add a few line of code to detect and parse old formatted files and run some extra “fumbling” on the csv before feeding them to current graphing engine ?
Maybe I am just dreaming ![]() ,However first step is obviously a comparaison of what was produced by QA400 and what is expected in the current CSV format ? to judge if and what can be “easily” or not be done
,However first step is obviously a comparaison of what was produced by QA400 and what is expected in the current CSV format ? to judge if and what can be “easily” or not be done ![]() A file description of both old and new format would help
A file description of both old and new format would help ![]()
Thanks anyhow for the time you took to respond ![]()
Didn’t realize time had flown so fast ! My tracking number via ups to France is in 2013 ! I don’t remember the price though. I was busy many years actually “building” the studio and only lately got back to maintaining and repairing / readying all for opening time…
Maybe I ought to invest in a new QA403, although technically the specs of the 400 are still enough to test consoles , preamps and RIAA stuff (vinyl lathe…) from the 70/80 ‘s !
With a notch I can probably even make measures on resistive voltage dividers Johnson noise ![]()
PS: I just pushes the envelope when it comes to “outdated” tech stuff which are still perfectly ok to use if only a bit twisted !
I find my Tek 2465b still way better , simpler and more serious test gear than my recent digital Rigol 924S scope, when in doubt I’ll look at the Tek to get a clear view !
Same for old analog audio gear !, I push to improove or rejuvenate / fix some old audio staples ![]()
Best Regards from le perche !
(if you ever visit chateaux de la Loire, we are driving distance, come by visit the studio and for a taste of food or wine or both !)
Eric @zenviewstudioslab