V 1.1.8 is now working via USB on QA402
1 Like
@MarkZ: You make a very great work for all users, thanks a lot!
I use the original software and yours side by side, both have their advantages.
2 Likes
Hi Mark
I really like all the improvements and features. Good job.
Using the scope feature, clicking on “Fit to X axis” gives this result:

Regards
Niels
Hi Niels,
I’m glad you’re liking it. I’m sure you noted I added the powerline frequency setting in Settings.
That picture is probably right. There’s so much data that it fills the entire window at that sizing. I thought about other things to do but fundamentally if you want to see all of the time data it doesn’t really fit in 1024 or 2048 across.
You’re running at 192000 sampling rate and an fft of 64K (1/3 the rate) so the packet is about 1/3 second (as seen above) or (at 1KHz) 330 cycles of a sine wave.
Mark
It’s definitely a massive visual improvement.You are a very talented programmer. ![]()
4 Likes
Hi Mark
Great with powerline frequency setting, thanks.
The “Fit to data” button could be changed to “Fit to frequency” where 1-2 cycles was displayed.
Regards
Niels
1 Like
Hi Mark
Measuring with squarewaves, please below:

The output from the analyzer is directly fed into the input.
I have tested on an analogue scope, and the result is the same
Regards
Niels
Hi Niels,
I’ve seen the same. I checked my output data to ensure it wasn’t me and I’m fairly sure it’s just the way the physical circuit works since it doesn’t have infinite bandwidth. Here’s a ‘photo’ capture of the same test but in code I’ve stuck the wave I send the QA403 as the right channel.
The ringing seems to have a cycle time of about 50KHz which would agree with sampling stuff and bandwidth.
-Mark

1 Like
Feature requests:
-
Latest versions with color selection also use the same color for waveform/spectrum display part. I’d like it to remain white (or inversed to black). Or better yet, allow separate color selection for it.
-
Add FFT sizes smaller than 32k.
-
Add higher number for allowed average selection, limit is now 6.
-
Add setting to disable font antialising.
Possible bug:
In spectrum view when I select 48k and try to use more averages than 1, spectrum stops running and Start button returns to active.
Another issue:
Is averaging actually working? 96k, 32k FFT, avg 6 looks very different with the official QA40x software.
Hi,
- Latest versions with color selection also use the same color for waveform/spectrum display part. I’d like it to remain white (or inversed to black). Or better yet, allow separate color selection for it.
Yeah, I agree. I’ve instead been trying to get themes working but everything I’ve tried has not been great so I may just add the color selection for the data area at least for now until I figure out dark.
- Add FFT sizes smaller than 32k.
I can, but other than very slight speed increase it’s not much benefit. It’s just a selector list so no big deal to add maybe 8 and 16K.
- Add higher number for allowed average selection, limit is now 6.
I’m not clear why you would ever want to average more than 6 times. I don’t think there’s any benefit after about 4 (and there’s a substantial time hit), but I guess that’s me. I usually run at 1 or 2. I can bump it to 10 (or anything else but it’s really diminishing returns).
- Add setting to disable font antialising.
That’s kind of a gnarly thing to change. Can you give me an idea of what this gets you? There are a bunch of not-great ways to do this all of them slightly different.
I was able to rarely replicate your issue with the scan stopping. Looks like a bug. I’ll track it down.
Due to older code (which has been removed, but…) I’m doing averaging in the time domain, not the frequency domain. That means it’s always nearly in-phase and will reduce the noise level.
Also, I think the REST interface isn’t averaging at all right now but will when I start averaging frequency - which is on my list.
I kind of like the time averaging so I left this for later. If you do averaging in-phase you should get very close to my results.
Mark
I use averaging to find low level signal peaks, with the original software I use 10-20.
About font antialising: It’s just me, I don’t like it, text looks soft. I have also disabled Windows’ Cleartype, replaced segoe ui fonts etc. Maybe with some 8k resolution 32" display I can finally enable it…
Adding these two lines to the start of MainWindow.xaml seemed to work for all QA40xPlot windows except chart title and level/freq. scales. But those a fine with antialising enabled.
It just needs user selectable option added for mode i.e. Aliased/ClearType/Grayscale. My programming skills came mainly from ChatGPT… ![]()
TextOptions.TextRenderingMode=“Aliased”
TextOptions.TextFormattingMode=“Display”
Hey Mark, I vote for more averages too if it’s do-able. The other thing would be adding 384k sample rate for the A/D (just for spectrum (external gen only) intermod and scope) I sometimes use the 384k option (A/D only) in the QA40x app.
Other than that, I really like your software. Oh, and the thick lines L+R (red/blue) seems to have gone a bit strange (colours) since the last update- is that deliberate?
About averaging:
Its update rate seems to be way slower in QA40xplot spectrum view. Using avg. 6/6 feels like it’s updating display 10x slower than the original software. And still the result looks like there is hardly any averaging done.
I don’t know how time vs. freq. avg differ or should look like. I just see that the original software and REW both do the averaging I want, while QA40xPlot does something different.
Here I’m looking for that 50Hz peak. 96k samplerate, att 0, 64k fft, 6 avg. Also notice how high frequency random noise is much reduced with the original software.
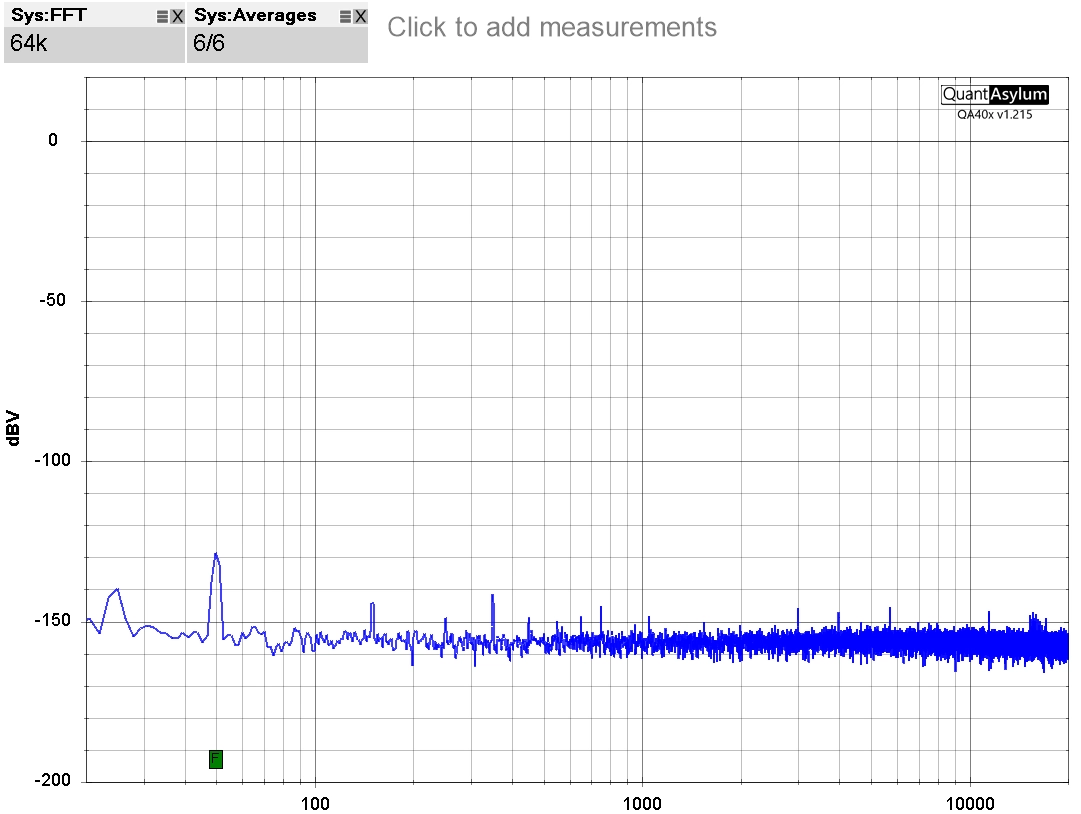


My QA403 (inputs with 50R terminators) Pretty much in agreement on noise. Essentially the same absolute RMS noise figure in uV (20-20k) on the tiles.
Never gets old looking at what this QA403 can do. ![]()
same 96k samplerate, att 0, 64k fft, 6 avg

You are getting some noise in, and perhaps some USB packet noise up the spectrum.

1 Like
Those pictures were just for a demo about the averaging differences. In order to show some noise and peak signal, I had my QA403 and loop cable located on top of a switchmode AC power supply.
Hi MarkT,
I use your software a lot, but with measurements of power I have some problems.
I put the input of the QA403 symm to a load resistor of 2/4/8 ohm switchable. Between the load resistor and the QA403 I installed in parallel a symm attenuator 40dB to protect the QA403. Using symm inputs I need to tell the program, that there is an attenuation of 34dB (40-6dB) in front of the inputs, but I don`t know where I have to do this.
The original software allows this and I get correct measurements up to 800W (controlled by a Fluke Multimeter in parallel of the load resistor).
Any hints?
Thanks
Christian
I’m pretty sure this would be relatively simple settings to add. And it would apply globally with maybe an indicator on the dash showing SE/BAL for generator outputs and inputs active.
Input attenuation entry- specified in dB
AND
Single ended or balanced input checkbox (6dB difference)
Single ended or balanced outputs checkbox (6dB difference)
1 Like