QA40xPlot Thread

Thanks for the feedback. Darn. Unfortunately, I don’t seem to get email pings for your replies, so I just saw this.

Whoops, it appears that my interpolation is failing if the frequency range at the low end doesn’t cover the test. I’ve fixed it for the next release. You might try adding one line at the top of your compensation file that just sets the compensation for 1Hz the same as your first line of compensation → like this

Sens Factor =.4829dB, SERNO: 70874
43.827 0.9024
44.372 0.9172
44.925 0.9318

to

Sens Factor =.4829dB, SERNO: 70874
1.00 0.9024
43.827 0.9024
44.372 0.9172
44.925 0.9318

and my guess is that it will work. But, as noted the next release (which I guess I’ll post today or tomorrow) will repair that.

Thanks again for being patient and testing. It’s a great help.

Mark

One last thing-- chirp is inherently (slightly) low accuracy - and in this test it’s used to determine gain for the entire frequency band. If you’re generating a lot of power in your amplifier I recommend you use the Input Voltage option for best results with Response. None of the other tests have this concern, but Response has to evaluate the entire response curve to set output voltage accurately. For loobacks it’s no problem but with a real amplifier with noise and things… I don’t know.

2 Likes

If anyone is curious, I’ve posted a video on youtube that does a fairly detailed look at QA40xPlot here:

It’s a little slow and you probably know much of it but there are plenty of good tips.

Mark

postscript: reposted to youtube with better audio… hence a new link

4 Likes

Thanks for the video. Your mic audio is pretty bad, lots of loud pops etc. Had to use an audio editor to “fix” it.

The new Softwareversion fixt all the Errors i found, thank you!:

Chirp with Compensation :wink:

2 Likes

Now a new little Error i found too, on the right Window if i hit no Data Points nothing happen, i need after that also to klick on “thick line” or “right Channel” and than the Points gone! But not only by hitting “no Data Points”

If you want to aktivate the Points, it works the same way, i need first aktivate the Points and hit on the “thick line” or right Channel" Button, than i see the Points again!

\o/

1 Like

Yeah, I noticed that. I tried to redo it after hearing it on youtube and my video editor’s filters didn’t really help. I’ll repair it in the next day or so since it’s obnoxious. It helps to turn the volume down a bit : )

Mark

Ok, I’ve posted a new video with some limiting of pops - I think it’s better but it might be wishful thinking.

1 Like

Hey Mark,

Please take a look here:

Do you think something like that could be implemented in qa40xplot?

By the way, I’m not sure if everyone fully realises it, but this software has huge potential, especially if more knowledgeable people get involved. Much appreciated for your effort!

1 Like

Hi @peppermint

Yes, I think so, but I’m not entirely sure which part of the video/test you’re pointing at here. Can you tell me the title of the ‘slide’ that’s being discussed? Is this startup time or looking at on/off clicks or ???

Mark

Hey Mark, thanks for getting back. it’s at 24:42 on the following video (time vs RMS Level) but also time vs THD+N would be very welcome :slight_smile:

watch this section of the video.

1 Like

Hi Mark,

Tried to install latest version 1.1.23.4 (with installer) today, but Avast Antivirus refused to run the program Launcher.exe because of maleware (IDP.Generic) in the program und moved it to quarantaine.
Thus, I installed a previous version (1.1.14). Great software! Appreciate the many plot options and user friendlyness.

I am using the QA403.

Unfortunately, I found that in QA40xPlot wrong math for calculating Intermodulation Distortion (both, SMPTE and DIN) is used, not following definitions for SMPTE and DIN according to their respective standards. Therefore the reported results are “by far too good to be true” and at disagreement with any other measurement and with QA403 genuine software (latest version by Matt), which I confirmed to use the correct calculation in the latest versions since V. 1.198 and newer.

The correct math for calculating intermodulation distortion according to SMPTE and DIN is outlined in this paper from Feb. 26, 2024:
https://www.virtins.com/doc/Measurements-of-Various-Intermodulation-Distortions-IMD-TD+N-DIM-using-Multi-Instrument.pdf

From what I see, in QA40xPlot in the SMPTE case you put the IM-component(s) at 7 kHz + 60 Hz and at 7 kHz - 60 Hz in relation to the fundamental at 60 Hz. Let’s assume in an example that the 60 Hz fundamental is at 0 dBV, the 7 kHz at -12 dBV (thus 4:1 ratio),and you have the IM-product at 7060 Hz and at 6940 Hz both at -136 dBV, then QA40xPlot reports in this case IMD = -130 dB. That is wrong, because the rms-sum of the IM-products should not be related to the 0 dBV fundamental at 60 Hz, but to the 7 kHz Signal which in a SMPTE measurement is always -12 dBV relative to the fundamental. Hence, the correct math would be:

step1: rms-summing of the two IM-signals at 6940 Hz and 7060 Hz, both being at -136 dB = -130 dB
step 2: putting the rms-sum of the IM-products (at both sides of the 60 Hz signal) in relation to the 7 kHz signal, which is at -12 dBV (NOT the 60 Hz fundamental!).
This -130 dB - (-12 dB) = 118 dB.

In this example, the result would be IMD (SMPTE) = -118 dB

The same mistake happens in Qa40xPlot in the DIN measurement, which should be identical in the data treatment, except, that the fundamental is at 250 Hz and the other frequency at 8 kHz. Both again in 4:1 ratio.

Similar to above SMPTE example, let’s assume for the DIN case 250 Hz at 0 dBV and 8 kHz at -12 dBV (4:1 ratio) and IM-products at 7750 Hz and 8250, both at -135 dB. The correct result for the IMD value (according to the definition of the DIN standard) should be -117 dB.
However, Qa40xPlot does some weird thing in the DIN case, it does not take -136 dB for the 7750 Hz IM-component, but about 4 dB less, -139 dB. The yellow point mark does not sit at the top of the IM-peak but close to its middle and its intensity is wrongly indicated and also wrong in the calculation used (in the DIN case only). How QA40xPlot is doing the math, I cannot figure out, but certainly wrong, because it reports in this example IMD = -126 dB which does not square with anything of the measured data. It seems the DIN case is completely screwed up.

Please see screen shot.

Best Regards
Reinhard

hi @captnaudio

Huh, I’m willing to believe I’m wrong there. The IMD stuff is the last summary data to get done and I just guessed at what to “dB” relative to - not realizing there was an actual spec. Also, a number of years ago I dropped my AES membership when all my work was only in the GHz region. So, I no longer have access to most of that technical doc. I’ll take a look and fix the IM math.

My guess is you’re also seeing issues caused by FFT binning.

Mark

Hi Mark,

Thanks for taking care of this!

In a nutshell, this is how it shall be done:

  1. Add the voltages (amplitudes) of both IM-components of the same order (order = the pair of the two IM-products symmetrically left and right of the upper frequency signal linearly.
  2. Sum the squares of these linear sums of each order and divide the total by the voltage (amplitude) of the upper frequency (7 kHz in case of SMPTE and 8 kHz in case of DIN).
  3. Calculate the square root of the result of 2 and express as dB and/or % IMD.

This is how it is outlined in the corresponding description in the above quoted paper from Wang Hongwei, Virtins Technology and is in line with the definition of the SMPTE and DIN standards, when measured from a spectral diagram (as QA40x does), often also named MOD IMD, which indicates that IMD is measured using spectral analysis instead of an original old analogue tool.

Regards
Reinhard

Thanks. Apparently IMD is viewed as modulating the higher frequency sine wave, producing sidebands. Makes sense.

I have been use the CEA IMD definition as shown as shown below- I dumped the .csv data into a spreadsheet that did the calculations (just for 19&20khz tones), but I would often be off by a frequency point so it required some “extra work”. I came across Mark’s program which showed the IMD right there, so started using that instead but was wondering how he did the calculations, though I never compared what my spreadsheet came up with vs his. The IMD’s I have measured and typically pretty darn low, like 0.00x%:

Hi VAR,

watch out for the nifty details.
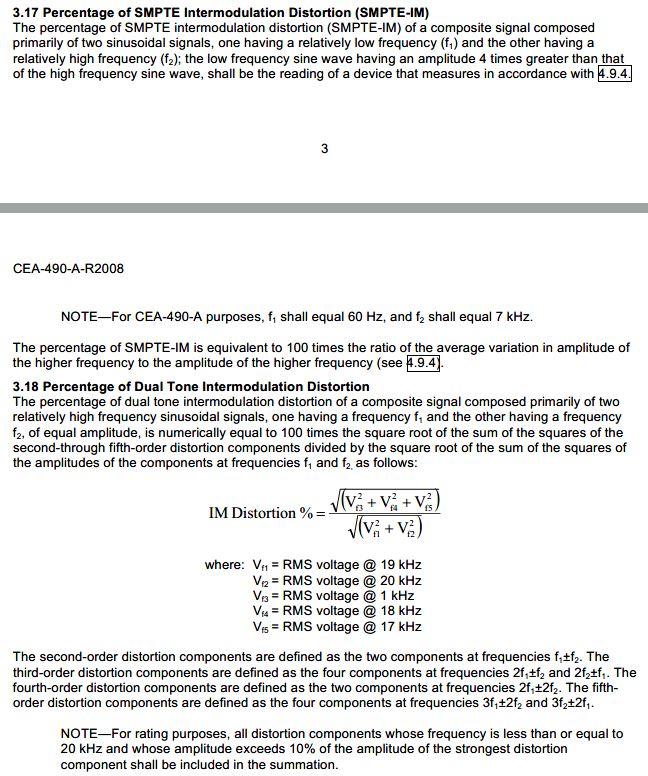
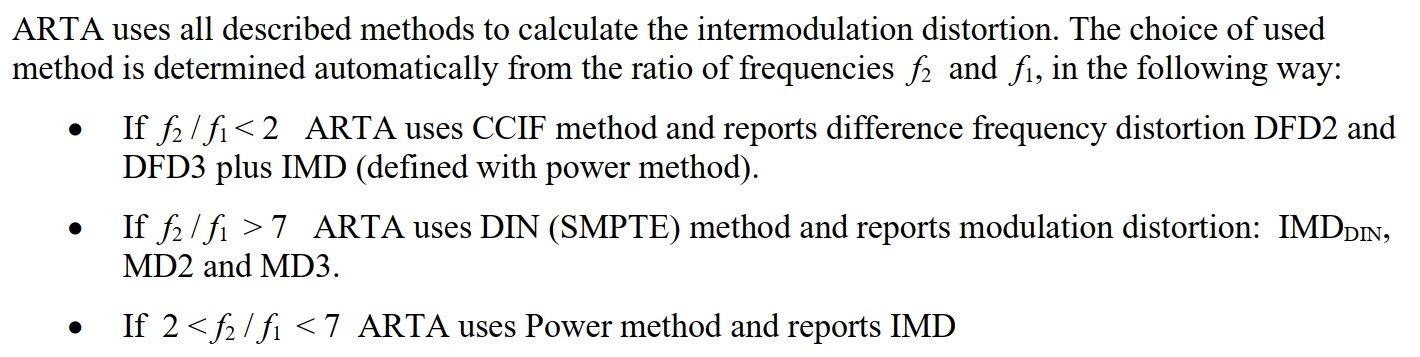
Section 3.17 is what I have been talking about, namely SMPTE and DIN. And that paragraph 3.17 in the paper you show is actually silent about how exactly the calculation shall be made for correct SMPTE and DIN readings.

Section 3.18 in your paper talks about generic “Dual Tone Intermodulation Distortion” which is different from SMPTE and DIN methods. The difference is twofold:
In the SMPTE and DIN methods the voltages of the same order of intermodulation must be linearly summed first before taking the square of the sum for each order. That is how each voltage for the same IM-order is obtained including the f1+nf1 AND f1+nf2 IM-components for the same order (same n). Then, In the second step, the obtained sum voltages for each order n must be geometrically (rms) summed, which means calculating the square root of the sum of the squares of each order. That is different in the nominator of your formula in paragraph 3.18, because that paragraph refers to the so called “power method” that is applied to generic Dual Tone IM measurements, but NOT to measurements according to SMPTE and DIN.

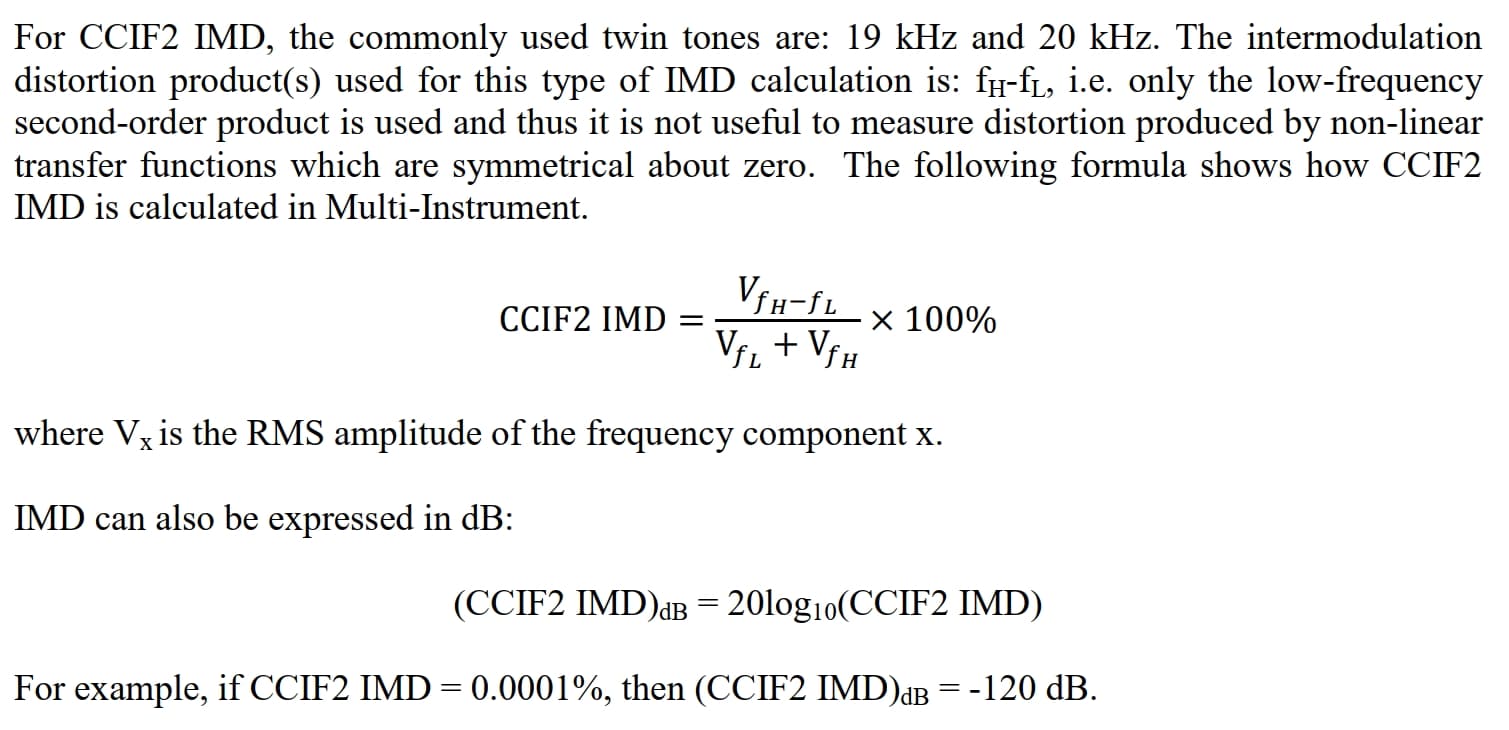
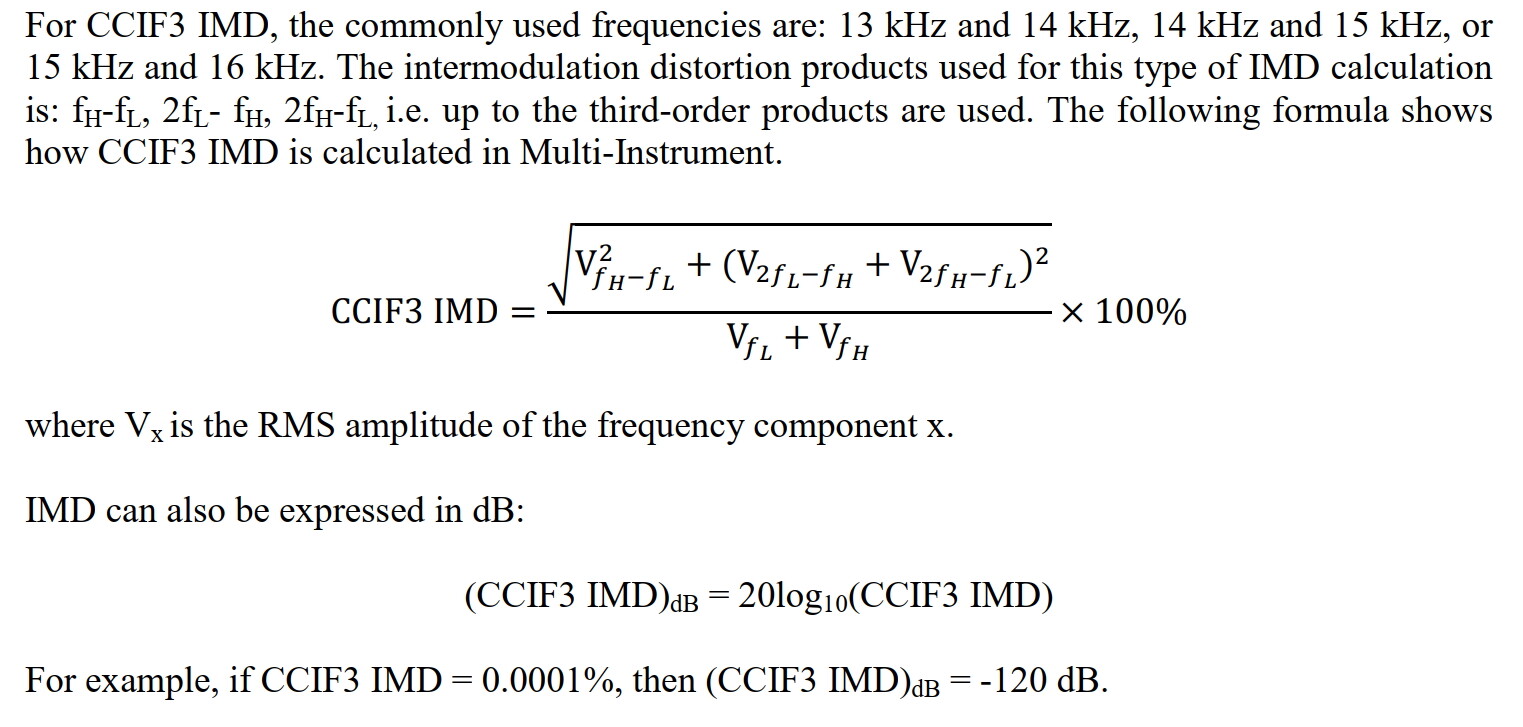
In generic Dual TONE IMD measurement one uses two frequencies 1 kHz apart, like 13 kHz and 14 kHz, or 18 kHz and 19 kHz and monitors the IM-products relative to the geometrical (rms) sum of Vf1 and Vf2. This is the so called “power method”, wherein the ratio of the power of the IM-products is related to the total power.

For SMPTE and DIN measurement however, the power method is not used, therefore the denominator is only Vf2, not the rms sum of Vf1 and Vf2.

It is unfortunate that IM Distortions are measured by different ways with different formulas and concepts behind. That is causing a lot of confusion and makes many measurements in different studies difficult to compare, especially if it isn’t said which method was used and how exactly.

For example in the so called “power method” of Intermodulation distortion measurement, employing f1 = 60 Hz and f2 = 7 kHz all IM-components (also those of the same order) are geometrically (rms) summed and related to f1 instead of f2 ((actually related to the rms sum of f1 and f2 and the sum of the power of all IM products , however since Vf1 and Vf2 are in a 4:1 ratio, the power of f2 can be neglected relatively to the power of f1 as well as the power of IM products relatively to the power of f1, that simplification isthe “simplified power method”). Clearly, that is not the SMPTE method, although it uses the same measurement set-up - but different calculation. It results in much lower distortion numbers (making it look better) than the calculation result according to the “real” SMPTE and DIN method. Linear summing the two components of the same IM-order of similar amplitude makes the sum about 3 dB larger than rms summing. Referring to f1 rather than to f2 as reference makes 12 dB difference! Overall, using the power method with two signals in a 4:1 ratio, results in an IMD value which is typically by about 9 dB “better” (lower) than if measured according to the SMPTE or DIN methods. For example, that is the case for IM-distortion values reported by RMAA (Right Mark Audio Analyzer).

Why is the sum of geometrical (rms) summing of two amplitudes by 3 dB less than with linear summing?

Linear summing of the amplitudes at the frequencies f2+nf1 and f2-nf1 for the same n, where both amplitudes are assumed to be equal, and of the size Vn:
Vn + Vn = 2x Vn
in dB: 20 x log(Vn) + 6 dB
(In SMPTE and DIN amplitudes belonging to the same IM-order are linearly summed)

Geometrical (rms) summing of the amplitudes at the frequencies f2+nf1 and f2-nf1 for the same n, where both amplitudes are assumed to be equal, and of the size Vn:
sqrt [(Vn)^2 + (Vn)^2] = sqrt [ 2 x (Vn)^2] = sqrt(2) x Vn = 1.414 x Vn
in dB: 20 x log(Vn) + 3 dB
(in SMPTE and DIN 4:1 IM methods amplitudes belonging to different IM-order are rms-summed)
However, in the power method all amplitudes of IM-products are rms-summed, regardless of IM-order)

If - like in the power method - all IM components (also those of the same order) are geometrically (rms) summed but the sum is related to f2, which one can find sometimes, makes the final IMD value by 6 dB better (lower) than with the correct SMPTE and DIN methods.

It is therefore mandatory that a method designated as Intermodulation Distortion measurement according to SMPTE and DIN uses the correct formula behind and not "some other, which is known from another, but different measurement method. Just this case, that we are talking here, shows, how important it is to stick to the standards in the official documents and not "something which sometimes may come close or which we believe may be applicable without having that confirmed.

Virtins Technology (Multi Instrument) had it wrong (have been using the simplified power method for SMPTE and DIN) for years until they corrected it finally in 2024 (I quoted the paper). I think, we should apply the right math, so tht the results with the QA40x is comparable with the results of an Audio Precision tool or a Multi-Sim tool or the softwares REW or ARTA, which all do it the right way.

Unfortunately the initial white paper related to IM-Measurement with the QA40x

[QA40x and IMD Measurements – QuantAsylum] from August 08, 2013

had it initially wrong as well as early software versions. But from QA402 / 403 software V. 1.198 onwards it was corrected, since then for the SMPTE and DIN method the right math was used.

Regards
Reinhard

1 Like

@captnaudio- thanks for taking all the time to explain the differences. Most of the specs on the older devices I see don’t specify what method is used, though a few specify using 60hz and 7khz, though I have seen one or two that use 70hz and 7khz.

Hi @VAR and @captnaudio

I’ve updated the code with the IMD changes from the Virtins paper. I applied the math to all of the IM tests, which isn’t correct, I guess - so I may go back and use power averaging for the CCIF style tests. I had not read your latest post(s).

I also swapped around the marker harmonics a little to be more in keeping with the concept of higher frequency sidebands, although tests like CCIF I think are more like RF IMD tests which do power averaging.

Please feel free to check the math - and thanks for the verbose help here, it really does help.

Direct link to the install: https://mzachmann.github.io/QAPlot/QA40xPlot.application

Mark

Hi Mark,

Thanks a lot!
Your concern is very valid that CCIF, also called ITU-T intermodulation measurement, applying two closely spaced frequency components f1 and f2 (i.e. 23 kHz and 14 kHz in 15 kHz limited DUTs, or 18 kHz and 19 kHz for amplifier testing) is a different animal. It is described in IEC 60118 and IEC 60268. It is also called “Difference Tone IMD” or “DFD”.

Actually both test signals f1 and f2 are of equal amplitude in this test.

The dominant IM-products are the difference frequencies:
f2-f1 (second order, = CCIF2)
2f2-f1 and 2f1-f2 (third order, = CCIF3)
Usually only 2nd order is measured or (optionally) 2nd order plus 3rd order.

Here, the math behind uses the power method.
The IMD with this method is defined as the square root of the ratio of the power of the
intermodulation distortion products to the square of the RMS amplitude sum of the two test
frequencies f1 and f2, reported as % or as dB.

It simplifies much for CCIF2:
IMD(CCIF2) = sqrt [(Vf2-f1)^2] / sqrt [(Vf1)^2 + (Vf2)^2]
IMD(CCIF2) = (Vf2-f1) / sqrt [(2 x (Vf1))^2], because Vf1 = Vf2 by method definition
IMD(CCIF2) = (Vf2-f1) / (2 x Vf1)

In case that the amplitudes Vf1 and Vf2 are not exactly the same but similar, the more general formula applies:
IMD(CCIF2) = (Vf2-f1) / (Vf1 + Vf2)

Paper from Virtins Technology on CCIF2:

IMD for CCIF3 (including the CCIF2 contribution) is more complicated, because both 3rd order components at 2f1-f2 and 2f2-f1 are first linearly summed, the sum is squared and added to the sqare of the 2nd order component at f2-f1, after which the square root is drawn of the total. Then related to the sum of Vf1 and Vf2.

(Note, that a difference to the SMPTE and DIN methods is the denominator which is the sum of Vf1 and Vf2 in CCIF, whereas in the SMPTE/DIN case it is Vf2 only). .

Virtins Technology:

In addition we got the “custom” case in QA40xPlot, which is user defined. Which method shall be applied in that case, SMPTE/DIN or power method or other?
For such case, ARTA applies it as follows:

That, I think, is just consequent.

Please check / correct if you got it differently so far.

I’ve just checked the new version of QA40xPlot you just uploaded:
DIN IMD → looks ok now
SMPTE IMD → looks ok now

CCIF (19/20 kHz) → wrong result
AES-17 MD → fails to initiate measurement and program crashes
AES-17 DFD → fails to initiate measurement, program does not crash though
TDFD → fails to initiate measurement
Custom with DIN IMD conditions → looks ok
Custom with SMPTE conditions → fails to initiate measurement and program crashes
Custom with CCIF conditions → wrong result

Best regards
Reinhard

Hmmm, I assumed CCIF and others would be wrong once I switched power calculations but what does it mean:

“fails to initiate measurement and program crashes”

I’m not seeing any of that. In debug mode I’m not seeing any exceptions or other things that would cause a crash or bad data (other than calculating the total intermod incorrectly for CCIF etc).

Can you please include a photo to show me the settings when it crashes for you and describe better what you mean?

Thanks,
Mark

postscript: Never mind, I was able to replicate this on the AES_MD. I’ll take care of it. Thanks for the bug report.

2nd postscript: holy cow this is messy. I like, and will implement, the ARTA method but pretty tough to explain to customers how this is all right when you have three different formulas for IMD.

1 Like

Just so you know, your efforts are appreciated. :slight_smile:

3 Likes