I have set up an old amplifier for measurement which has high IMD. With that one it is easy to compare different software (QA40xPlot, REW, ARTA) while the hardware remains the same.
I know, that a comparison at this point is premature. Perhaps it can help to spot the differences in the formulas to get it right. Its difficult enough because of the definitions lack the required precision in many documents. And no guarantee, That REW is always right here.
Currently (9 pm CET, Berlin) my results are these:
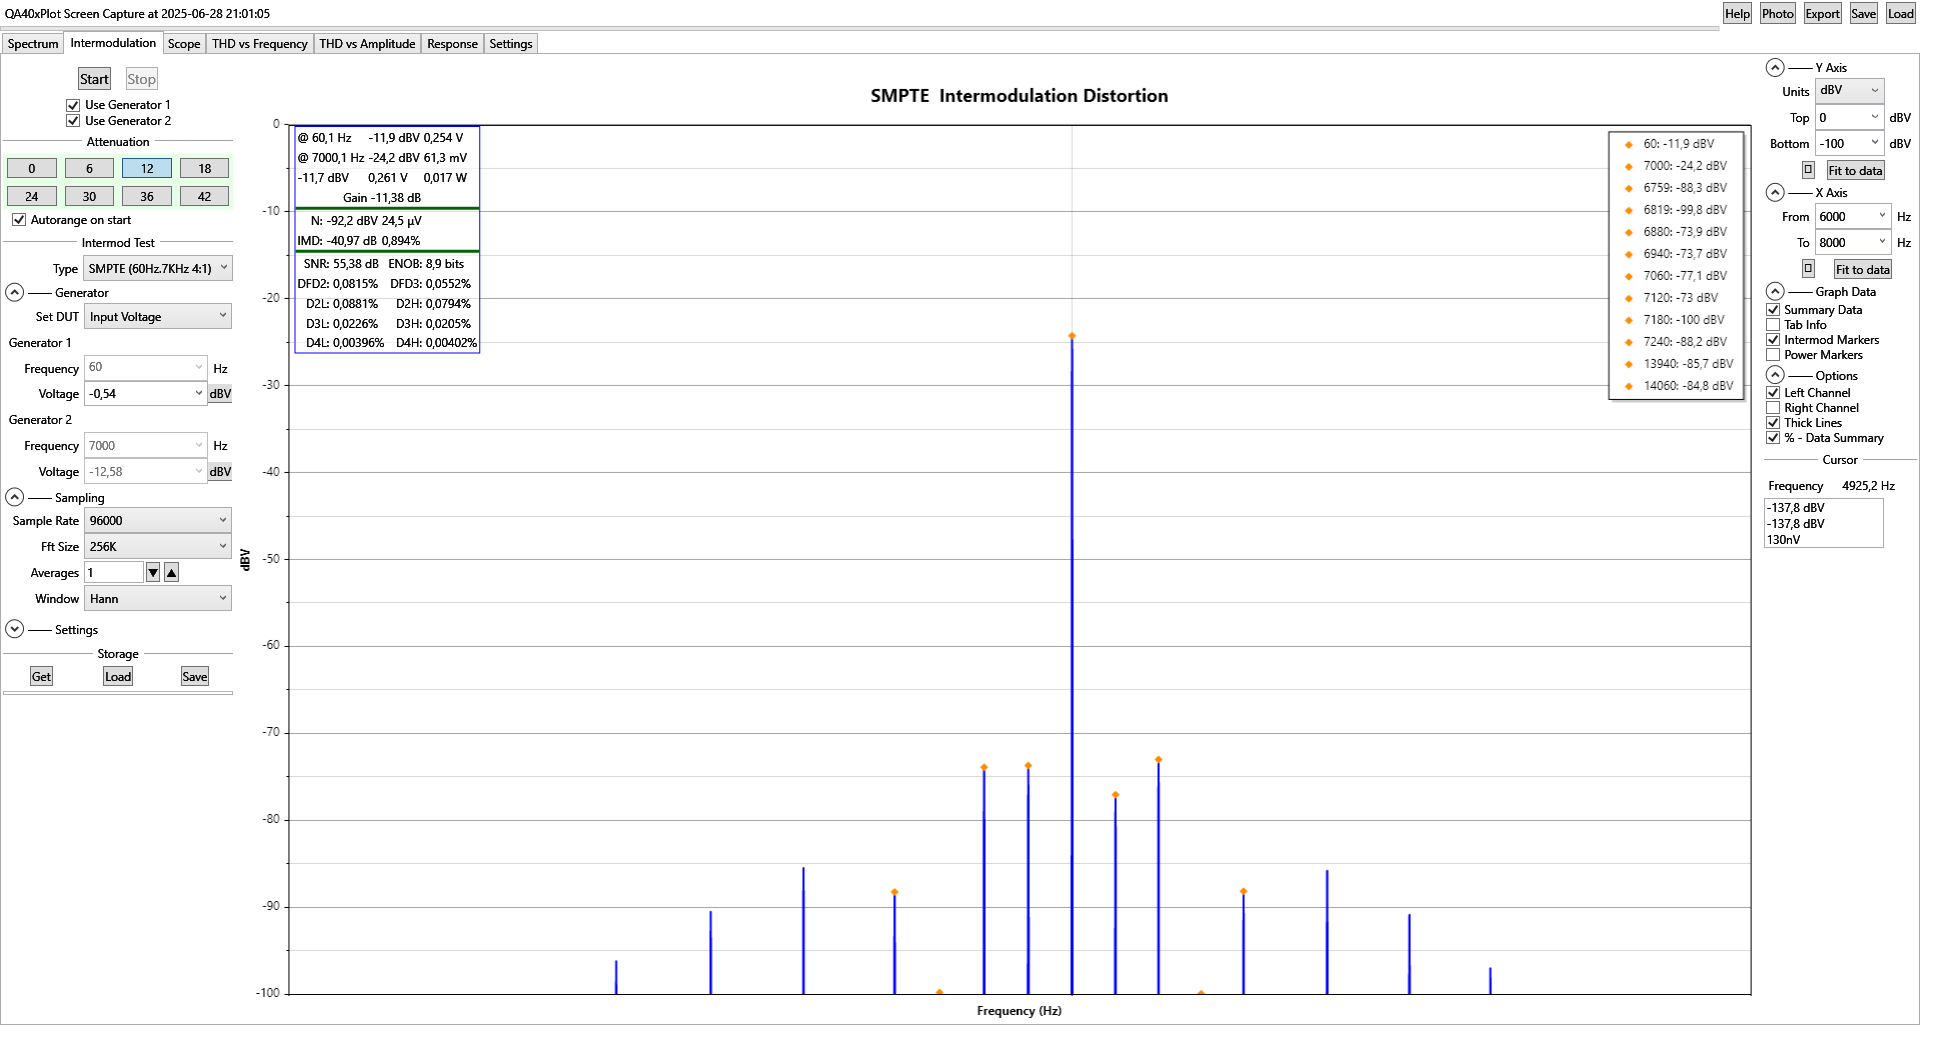
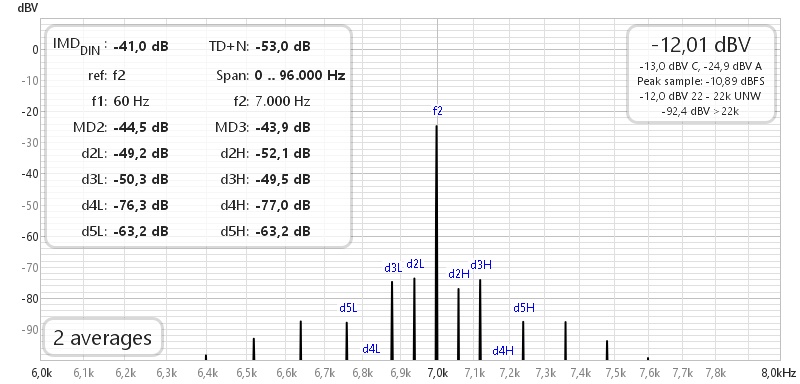
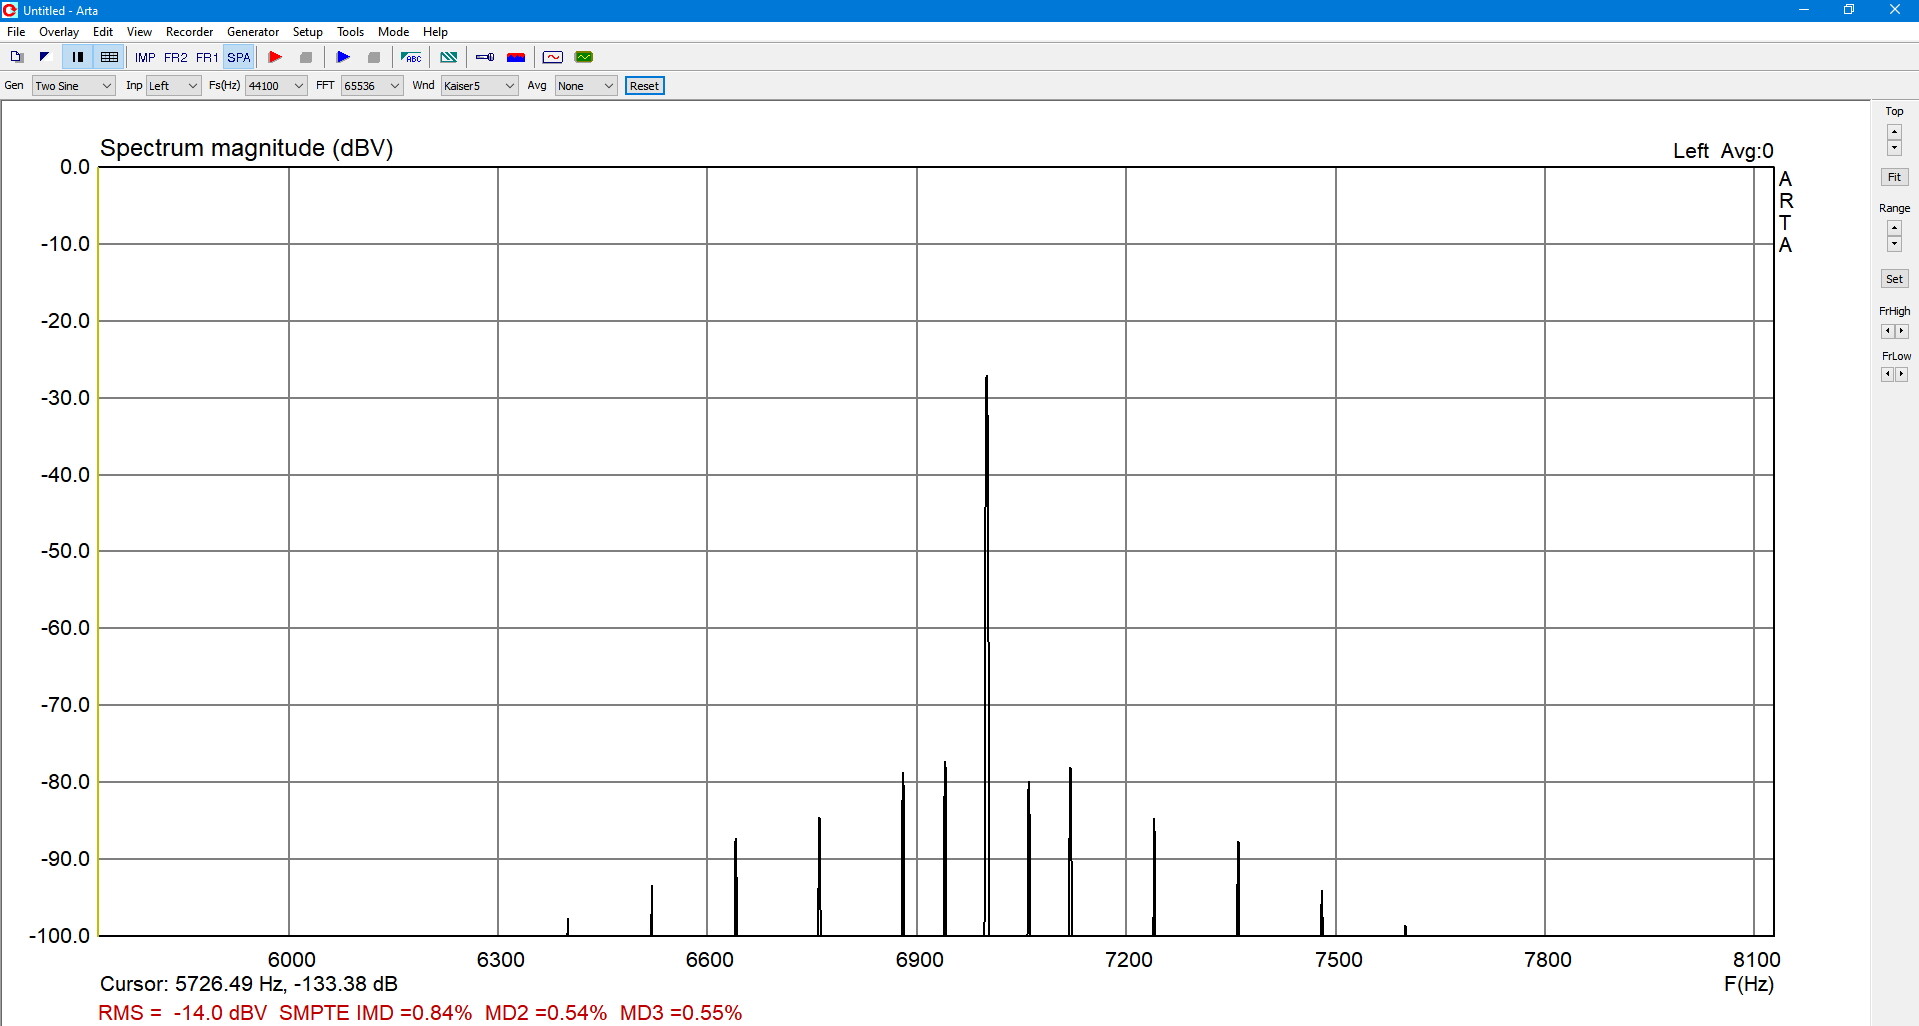
1. SMPTE 60 Hz +7 kHz 4:1
QA40xPlot and REW as well as ARTA: Same result within 1 dB.
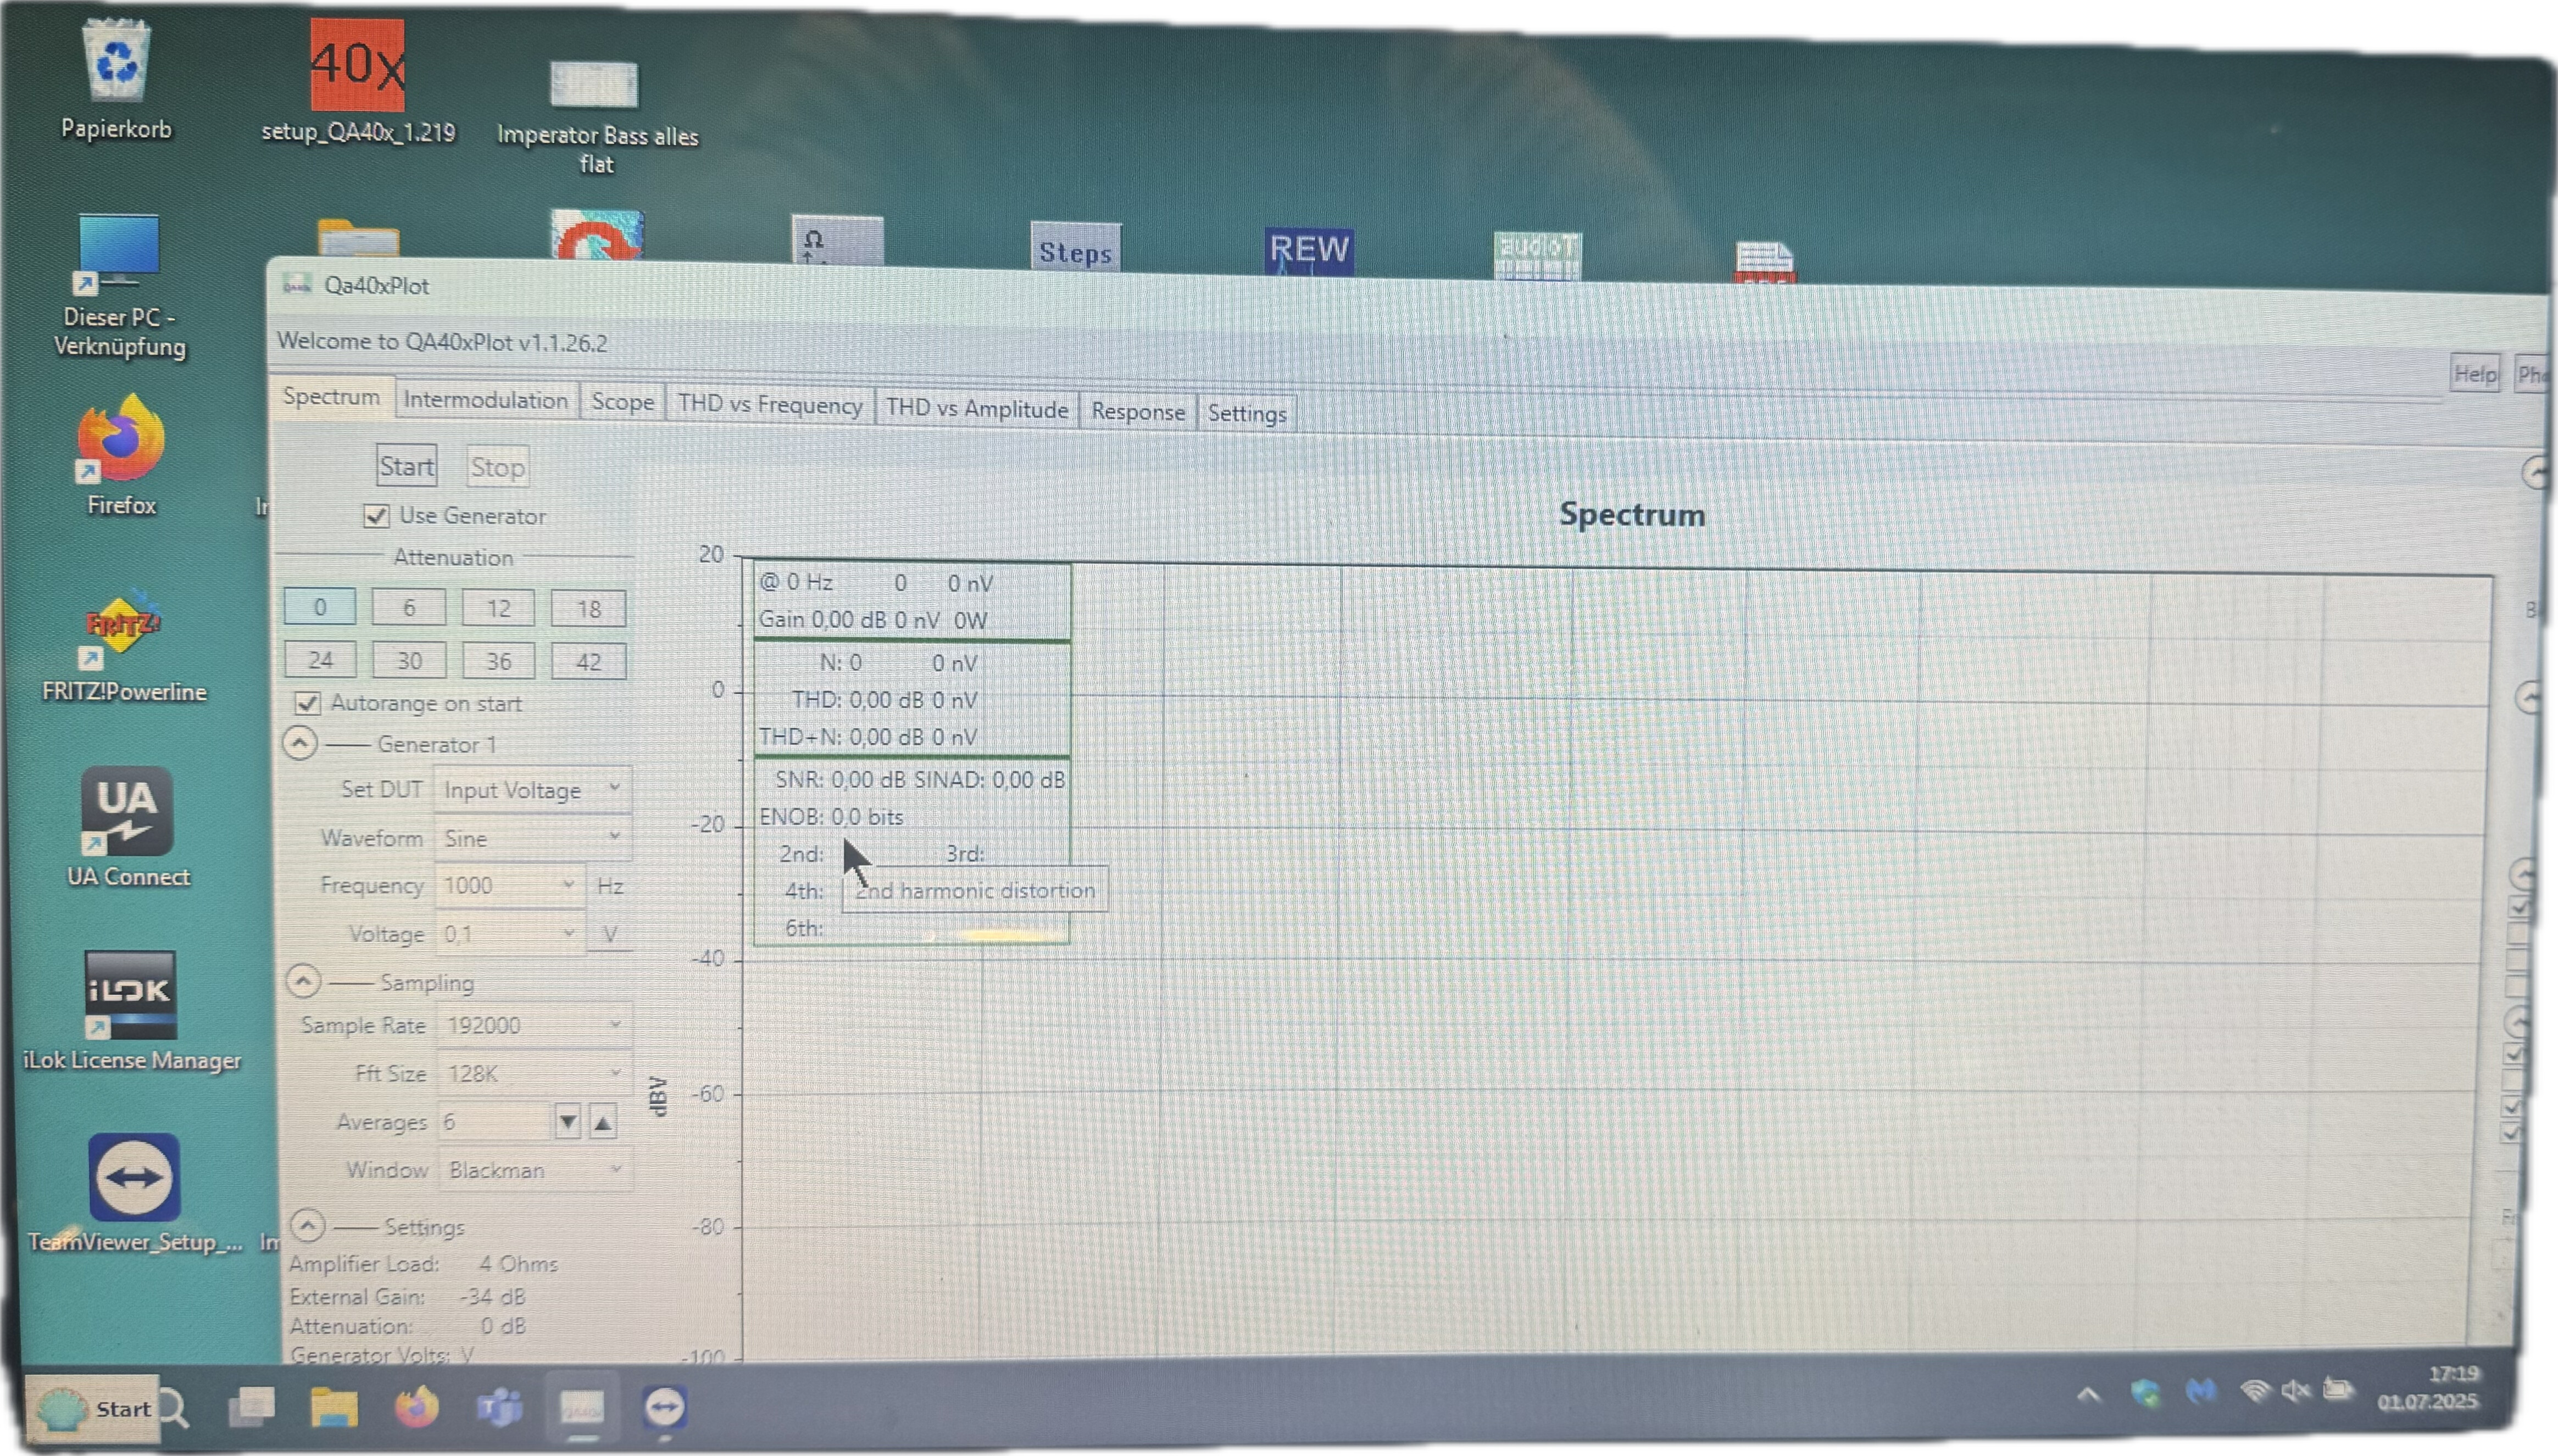
a) QA40xPlot
b) REW
c) ARTA IMD = 0,84 % = -41,5 dB
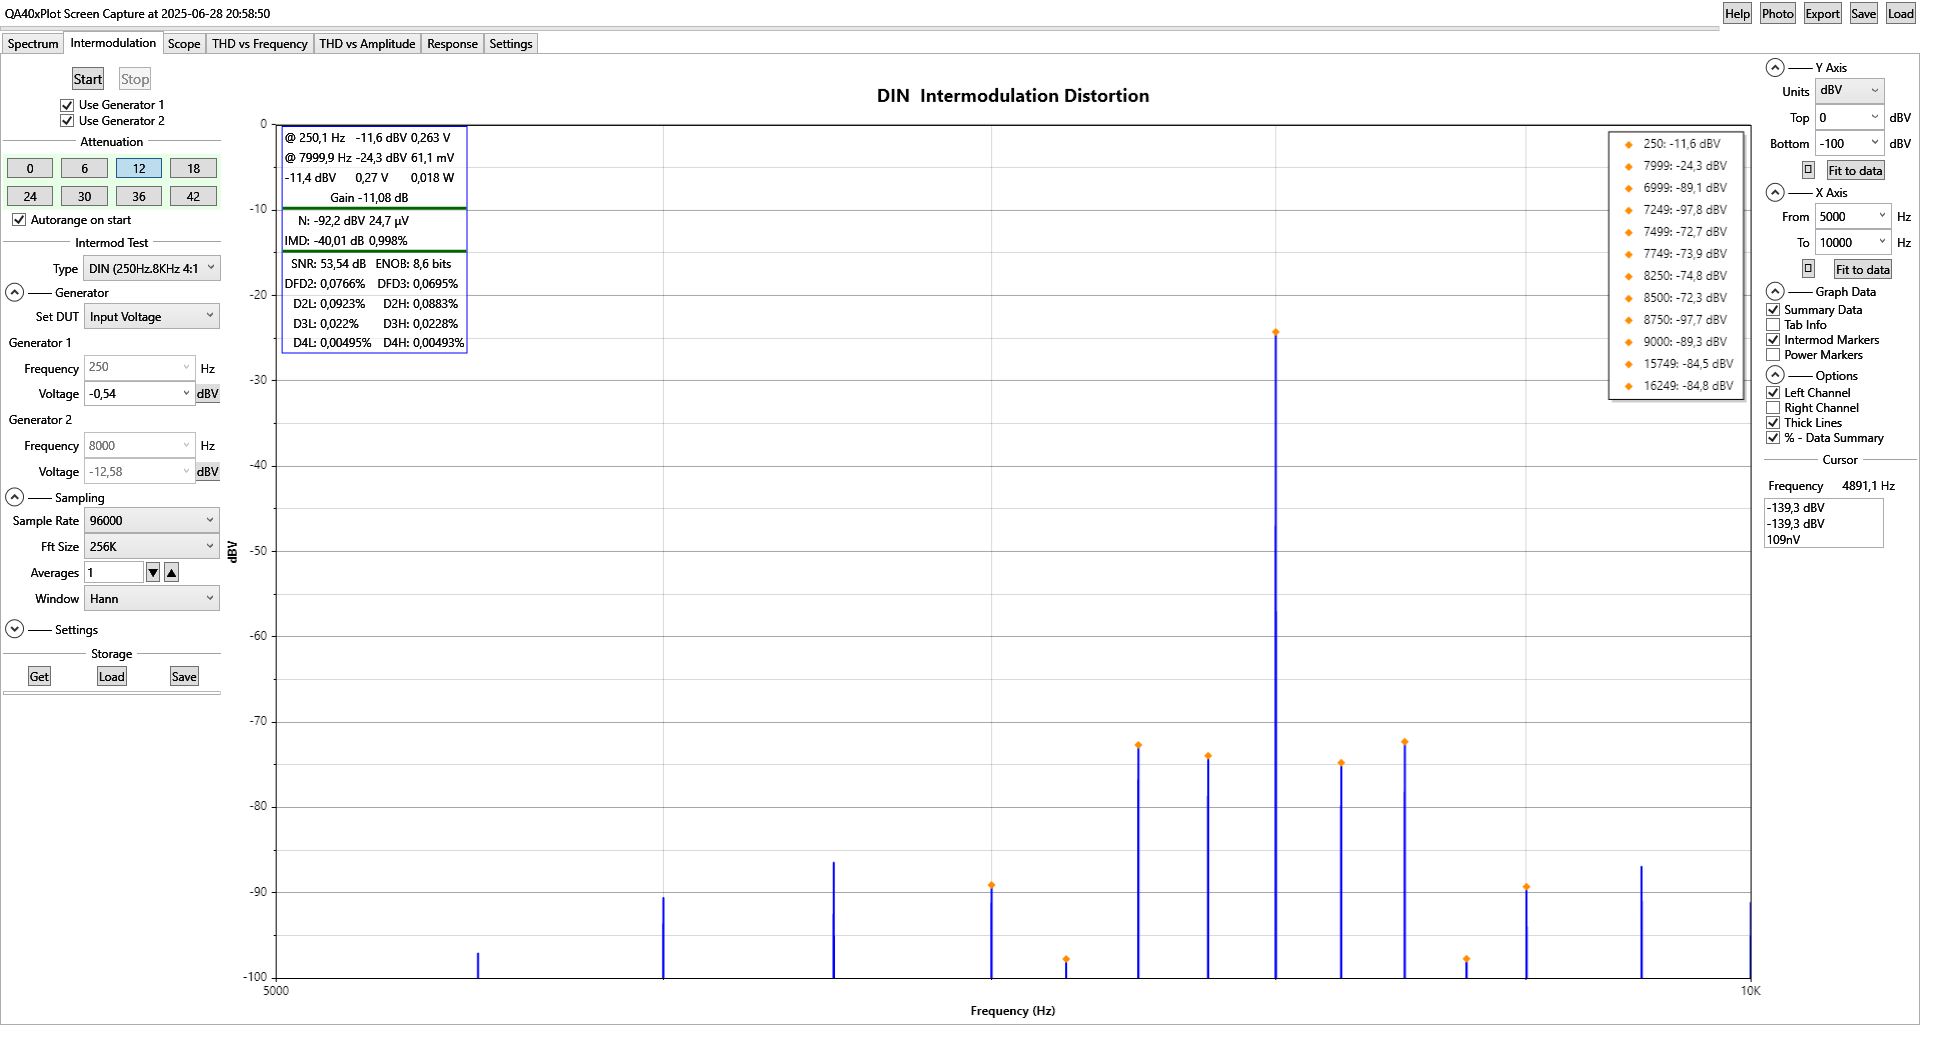
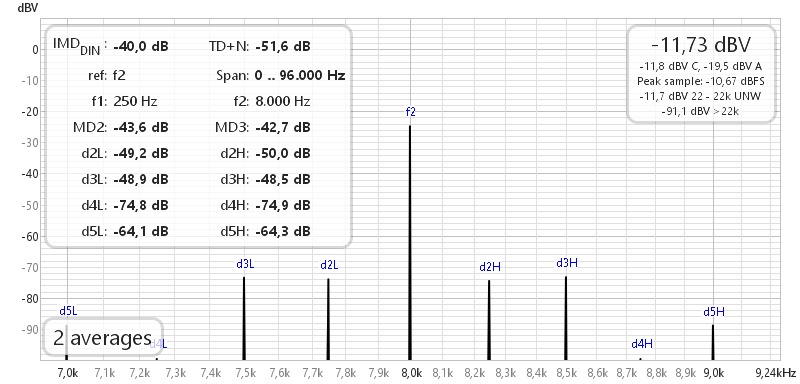
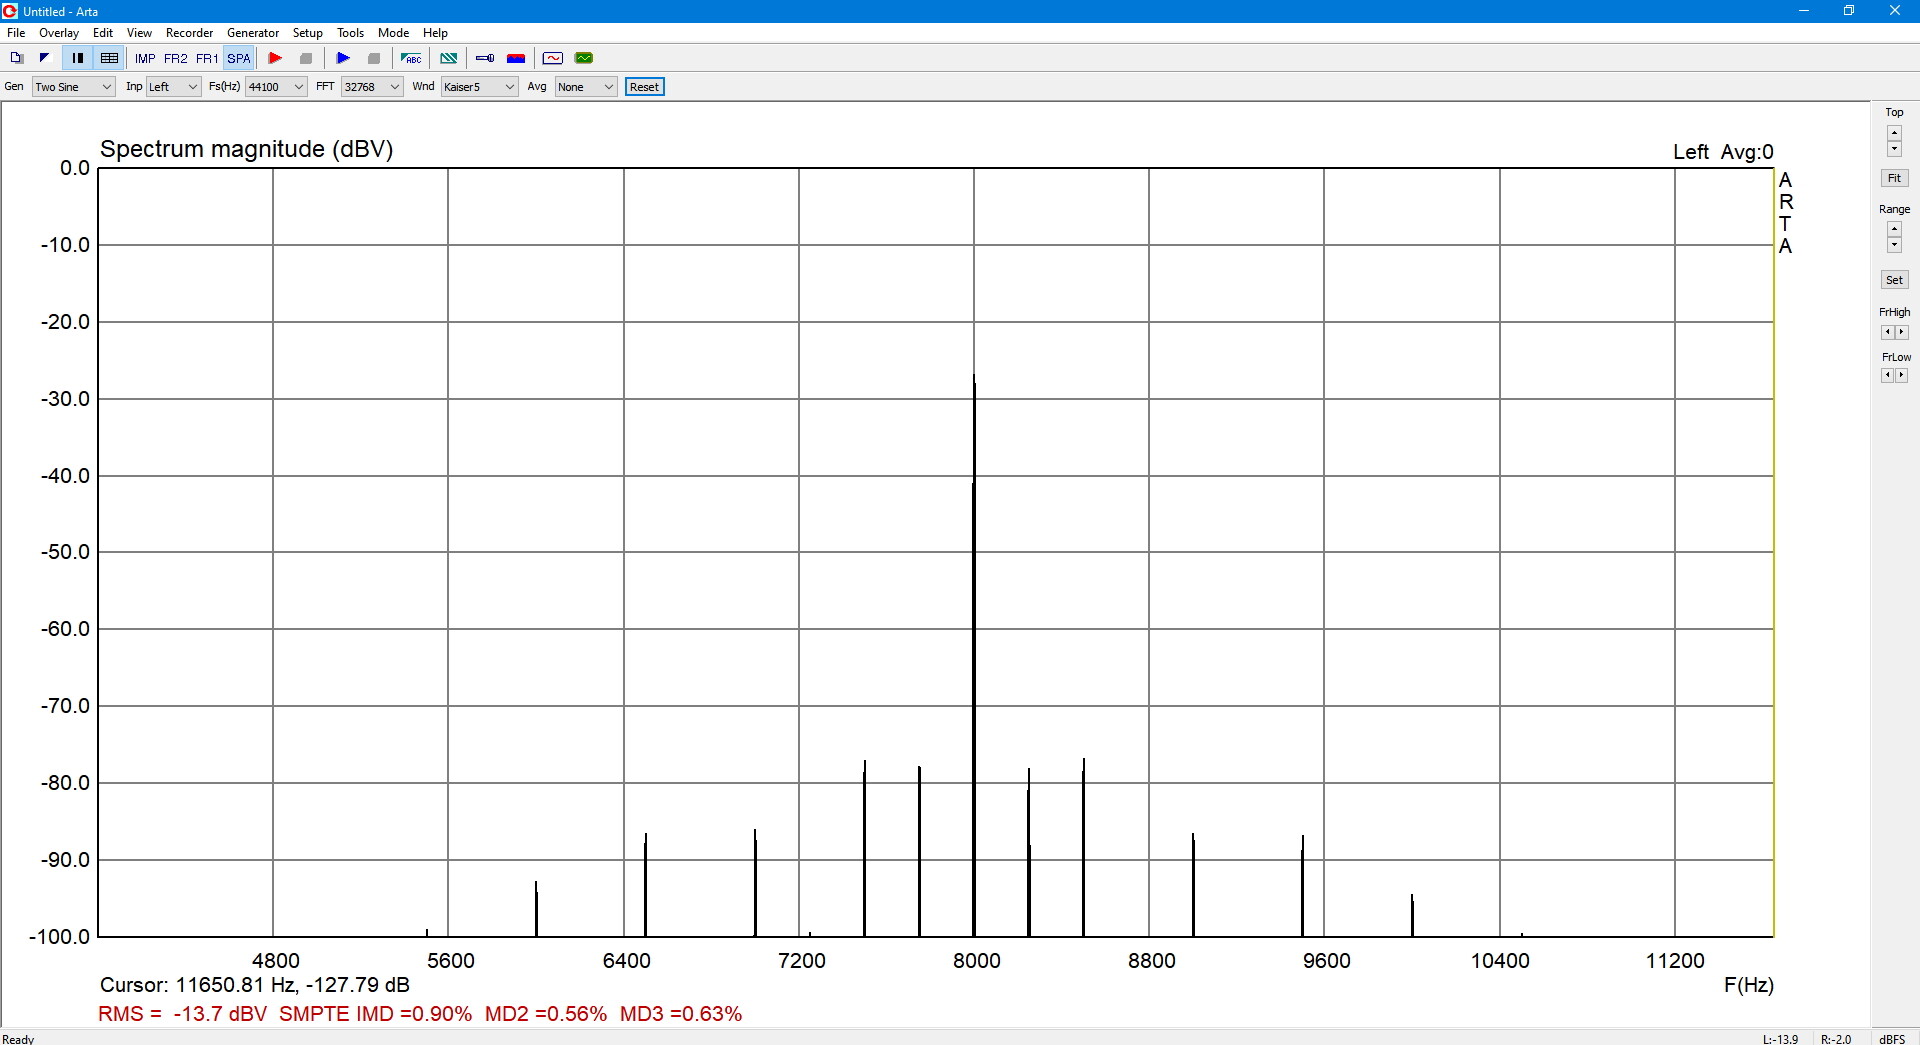
2. DIN 250 Hz +8 kHz 4:1
QA40xPlot and REW as well as ARTA: Same result within 1 dB.
a) QA40xPlot
b) REW
c) ARTA
DIN IMD = 0,90 % = -41 dB
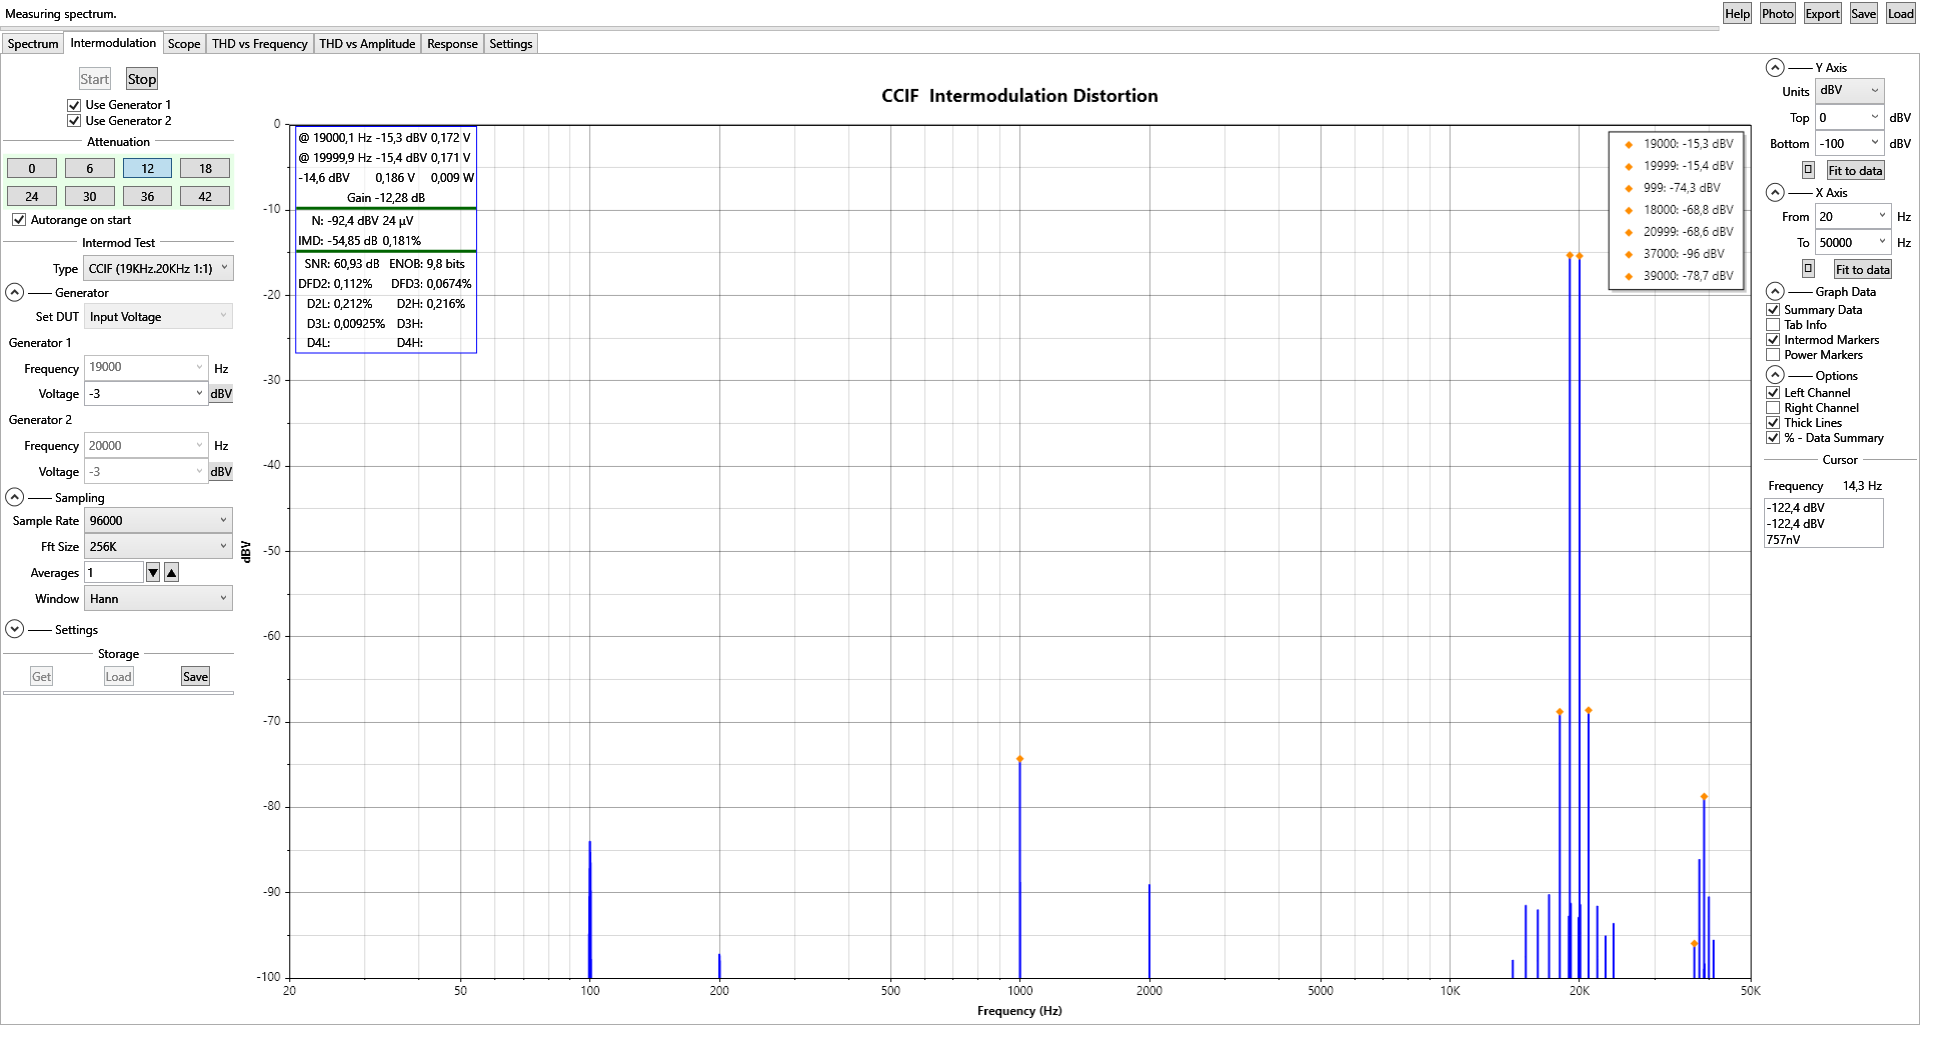
3. CCIF 19 kHz + 20 kHz 1:1
QA40xPlot and REW as well as ARTA almost same result (2 dB difference)
However, in QA40xPlot the total voltage in summary window cannot be right, shown there as -14,6 dBV, although f1 (19 kHz) and f2 (20 kHz) are each at -15,3 dB. Total voltage shall be at least being indicated as -12,3 dB.
a) QA40xPlot
b) REW
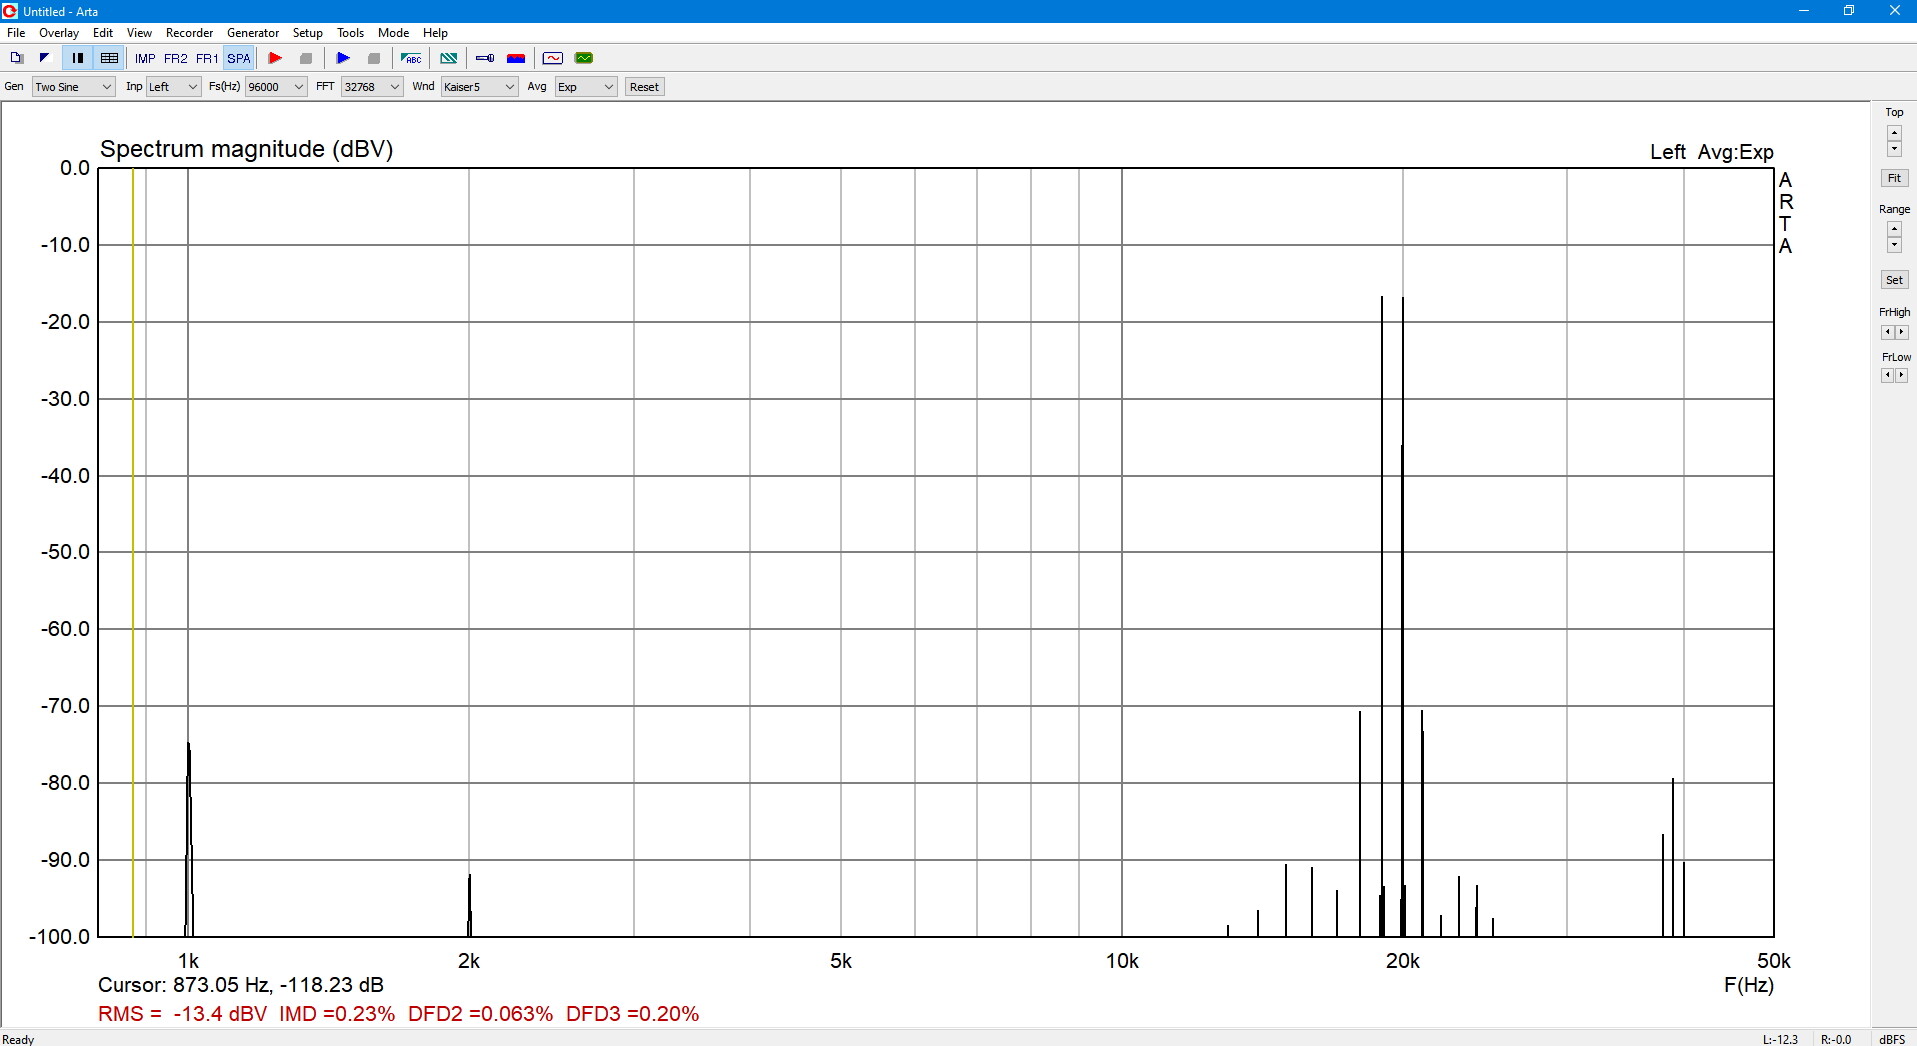
c) ARTA IMD = 0,23 % = -52,8 dB
4. AES-17 MD 41 Hz +7993 Hz 4:1
QA40xPlot and REW differ by 6 dB. ARTA (using SMPTE method) is close to QA40xPlot.
Because the SMPTE/DIN method is using arithmetic summing for the components belonging to the same order, before rms summing all orders that makes the SMPTE result 3 db larger than the AES method.
Where the other remaining 3 dB difference is coming from, no idea.
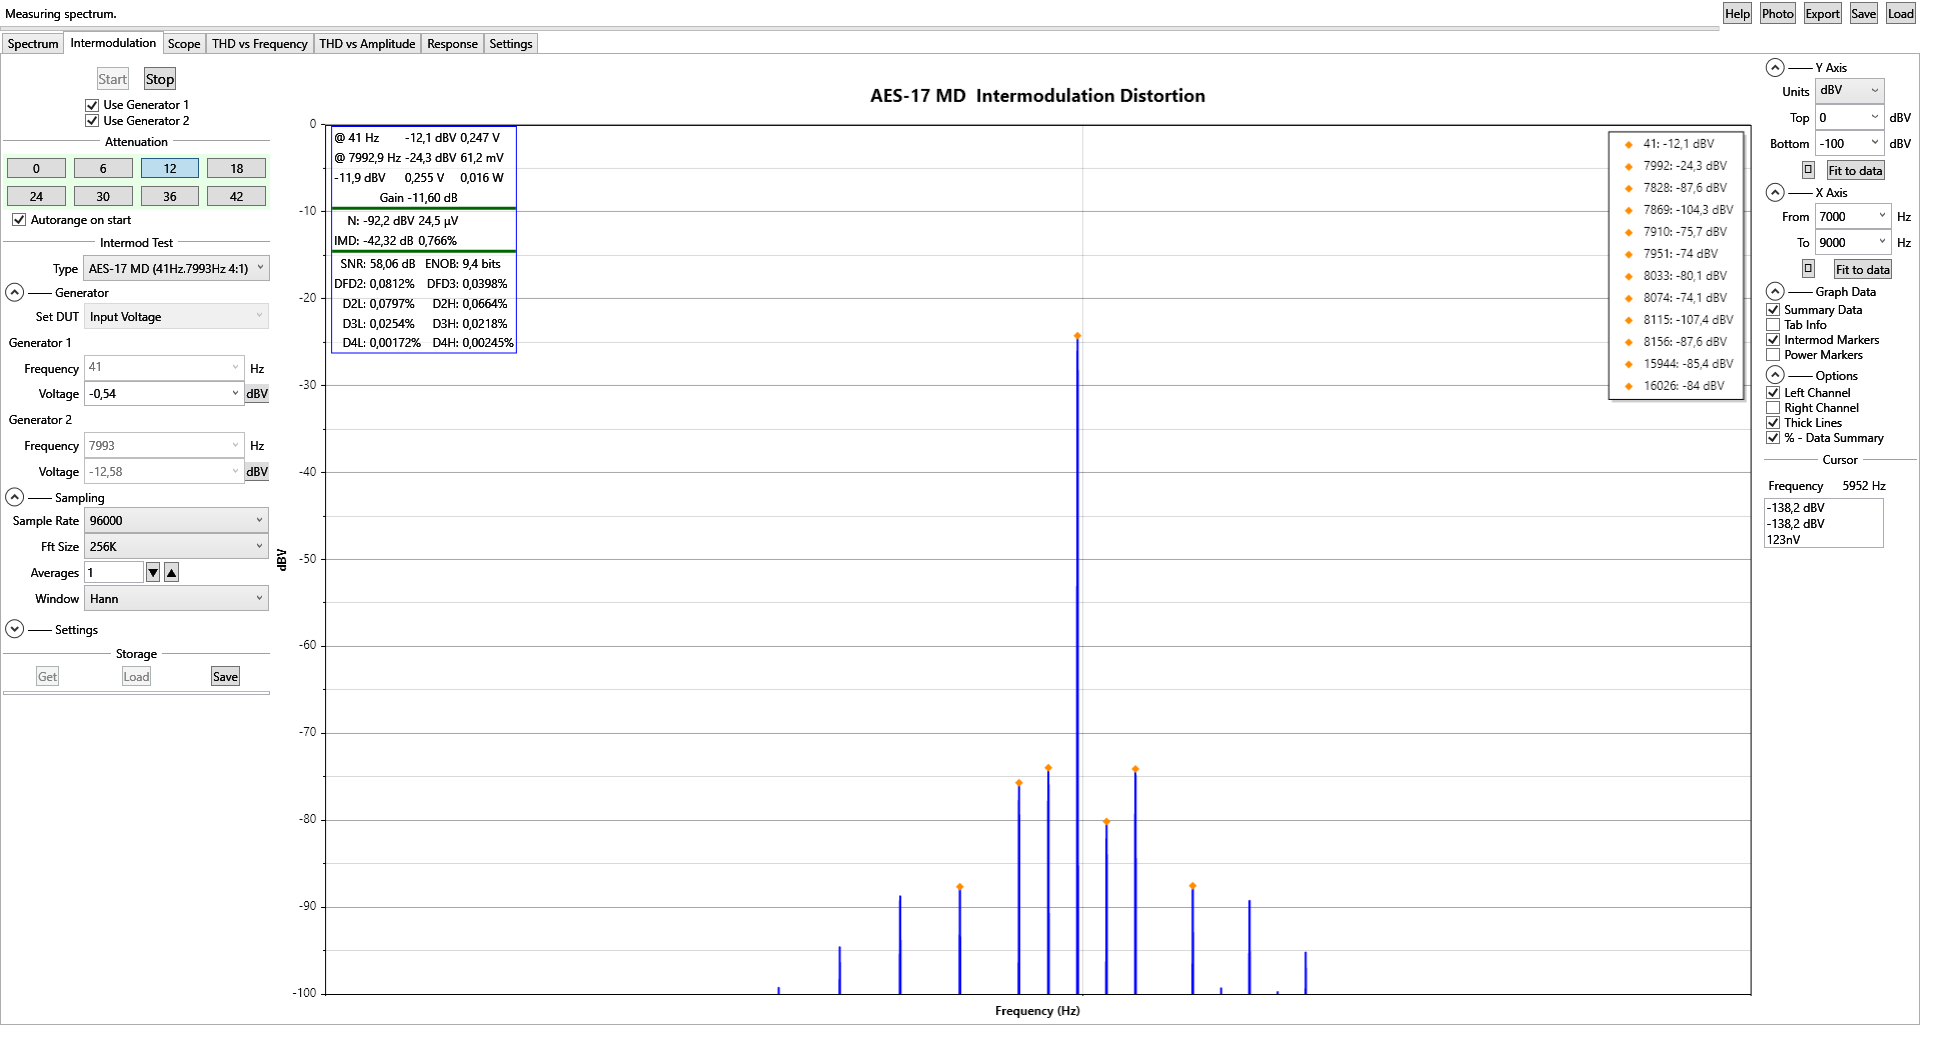
a) QA40xPlot
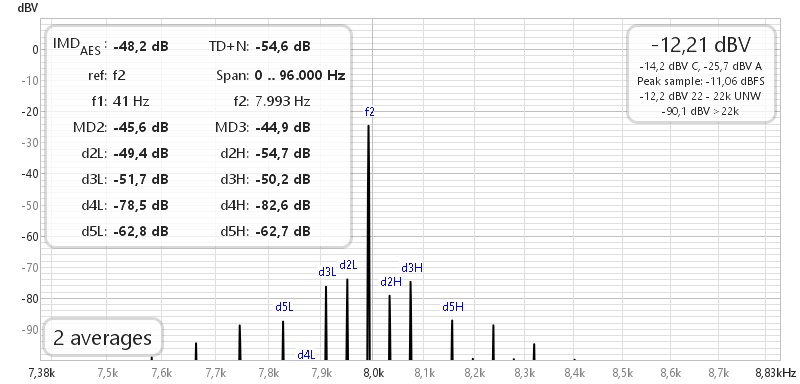
b) REW
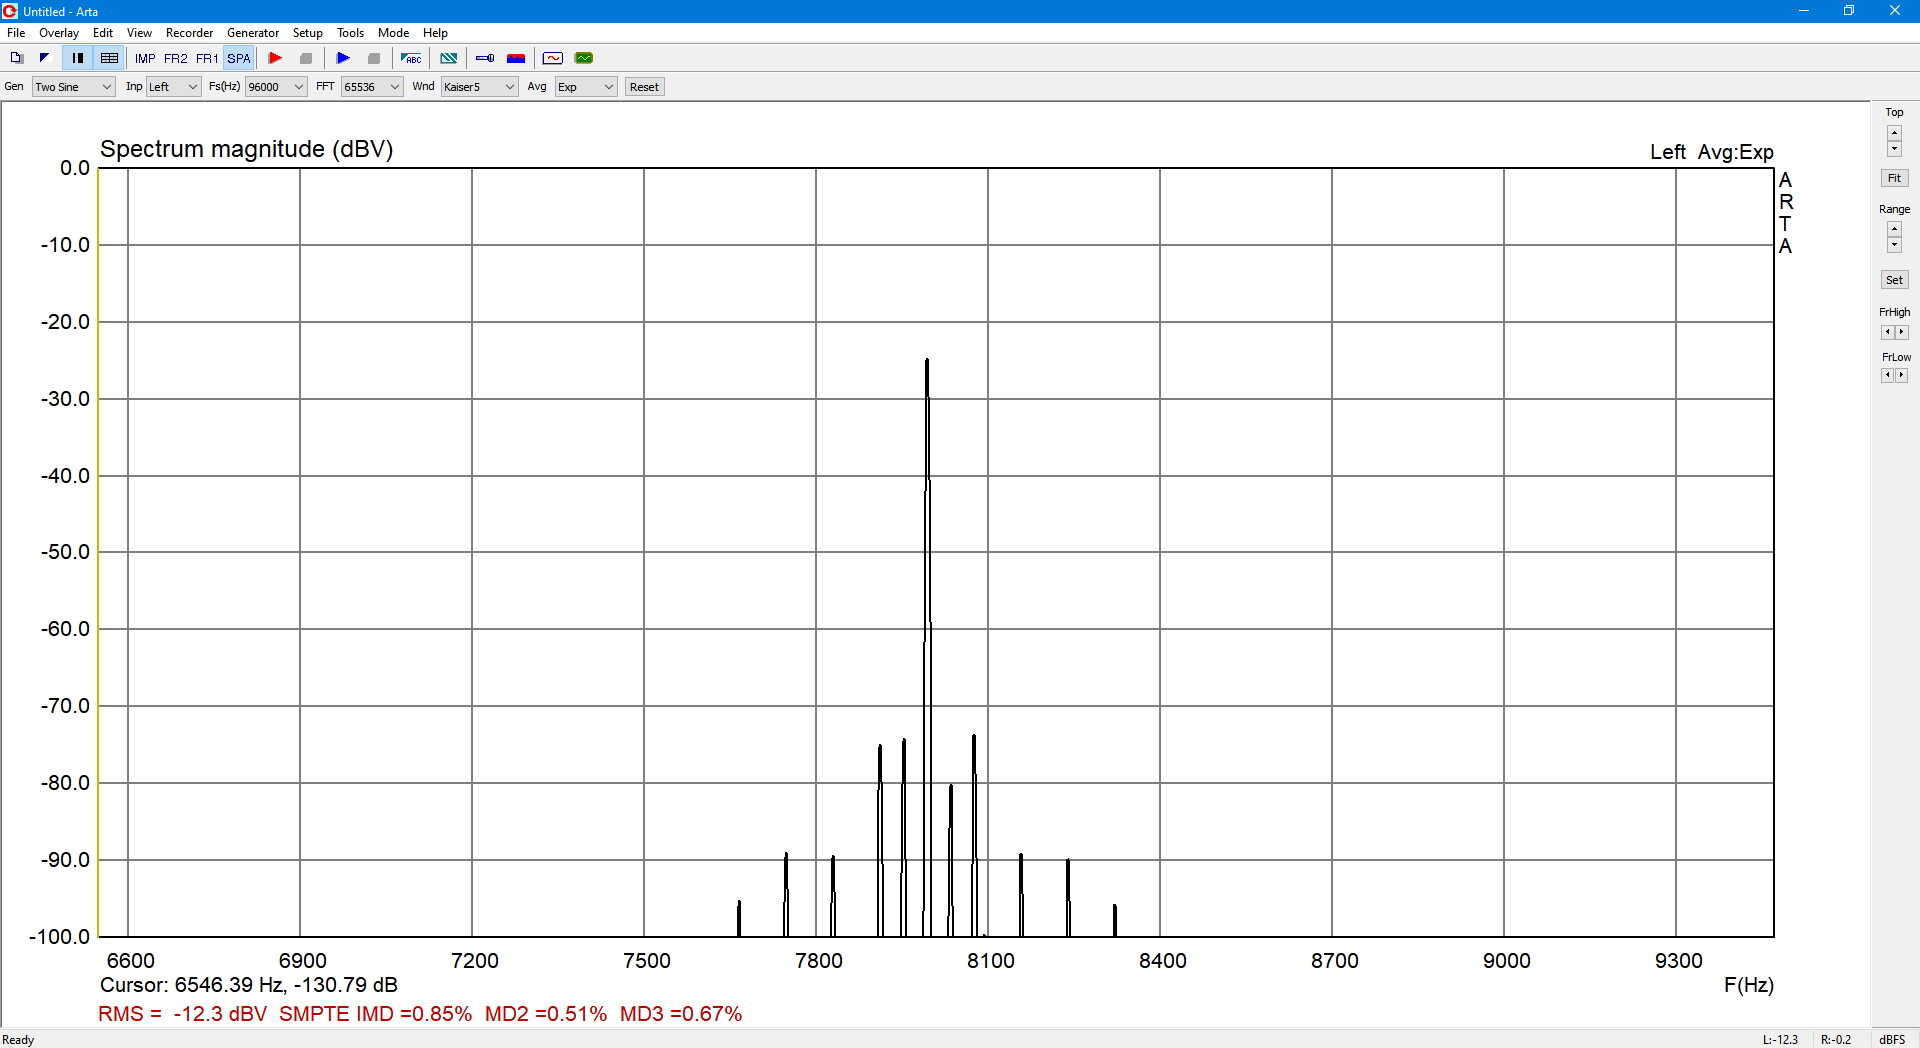
c) ARTA IMD 0,85 % = -41,4 dB
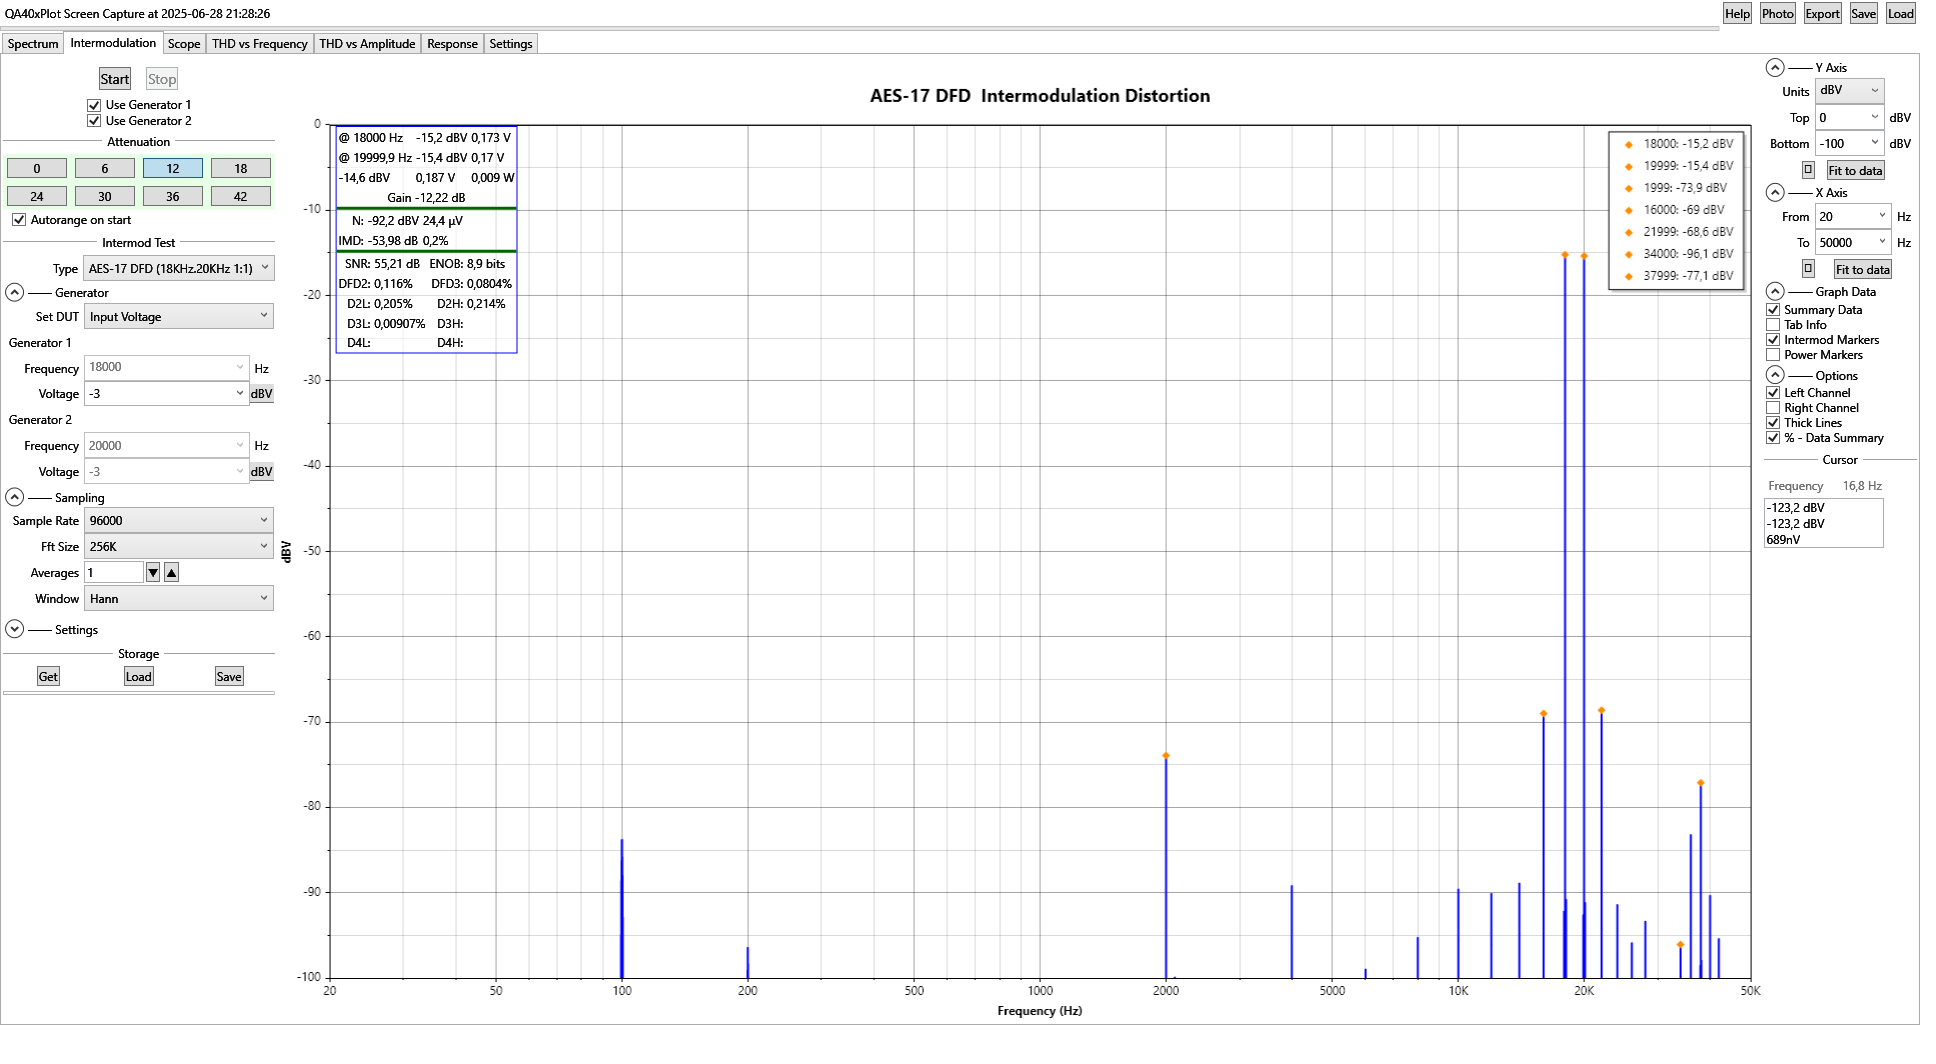
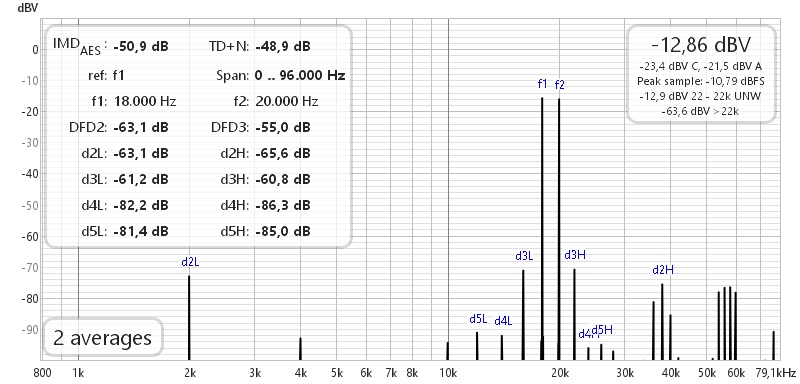
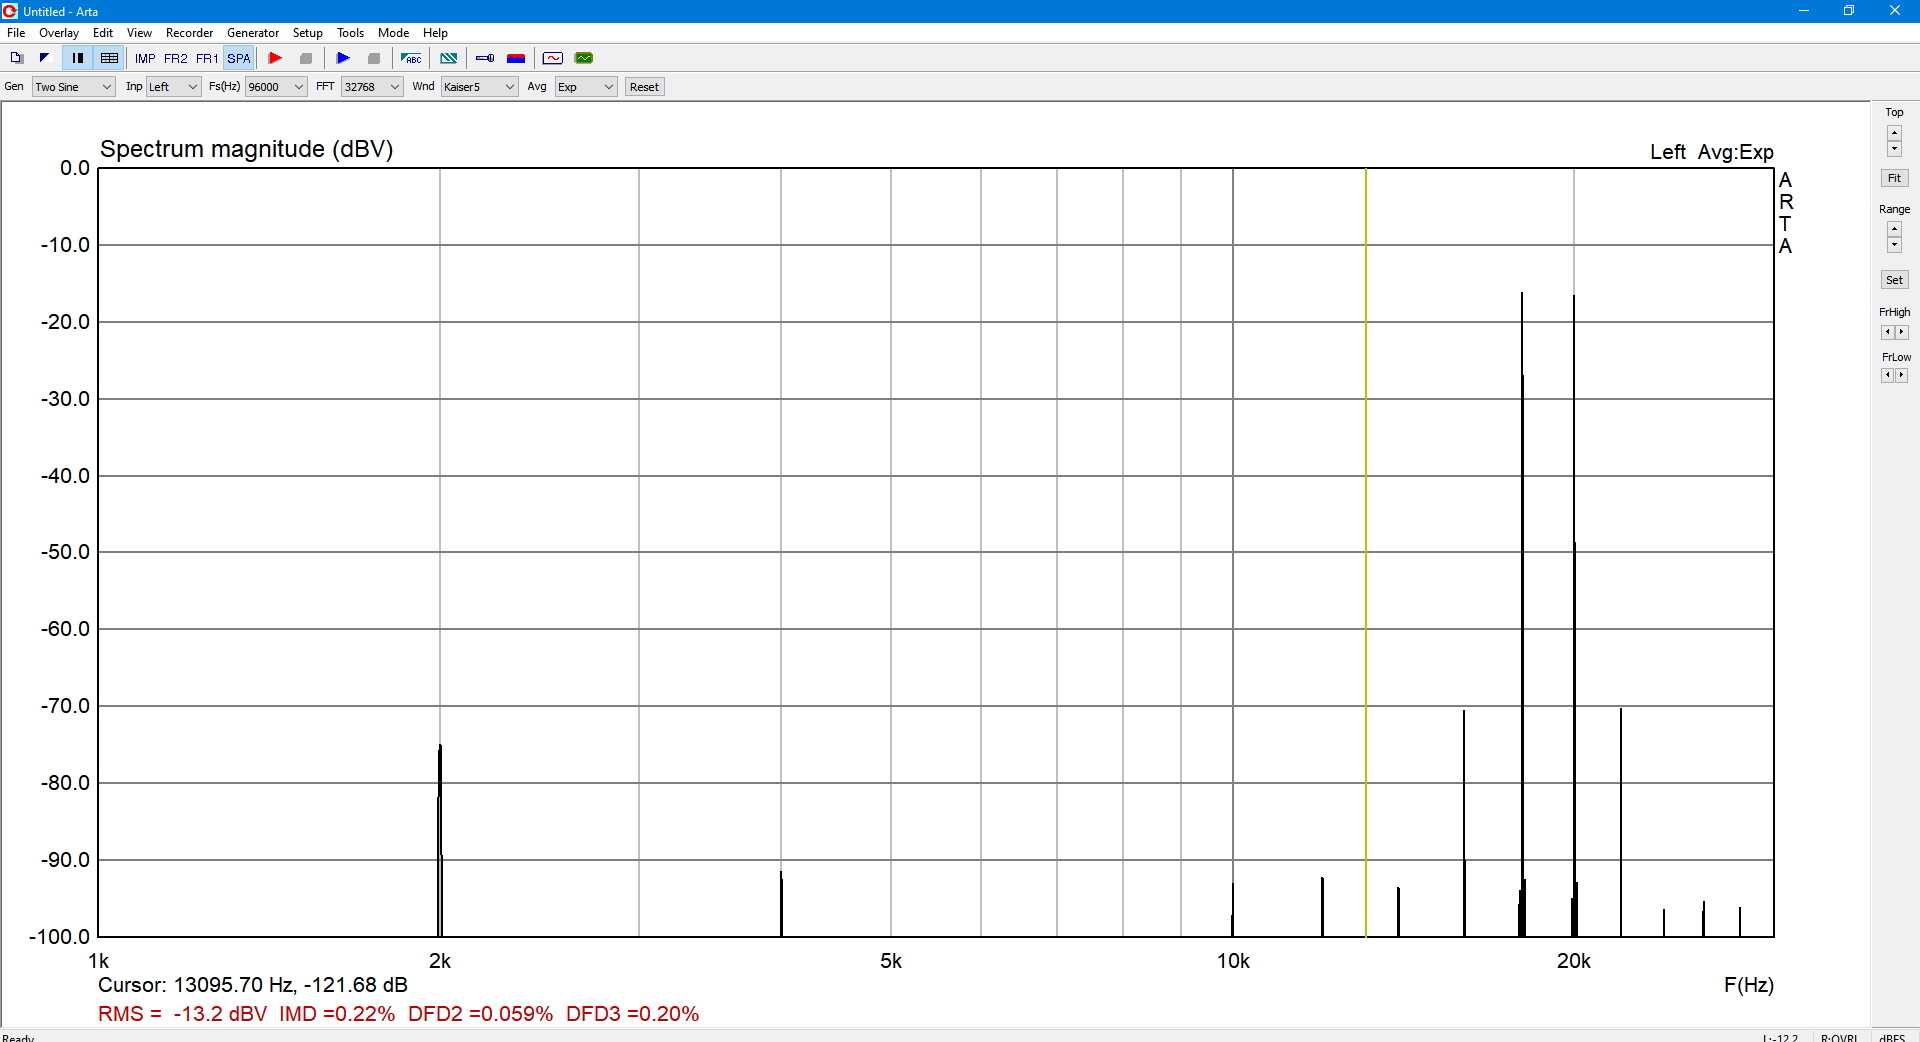
5. AES-17 DFD 18 kHz + 20 kHz 1:1
QA40xPlot and REW differ by 3 dB. ARTA, using the CCIF method, is close to QA40xPlot.
a) QA40xPlot
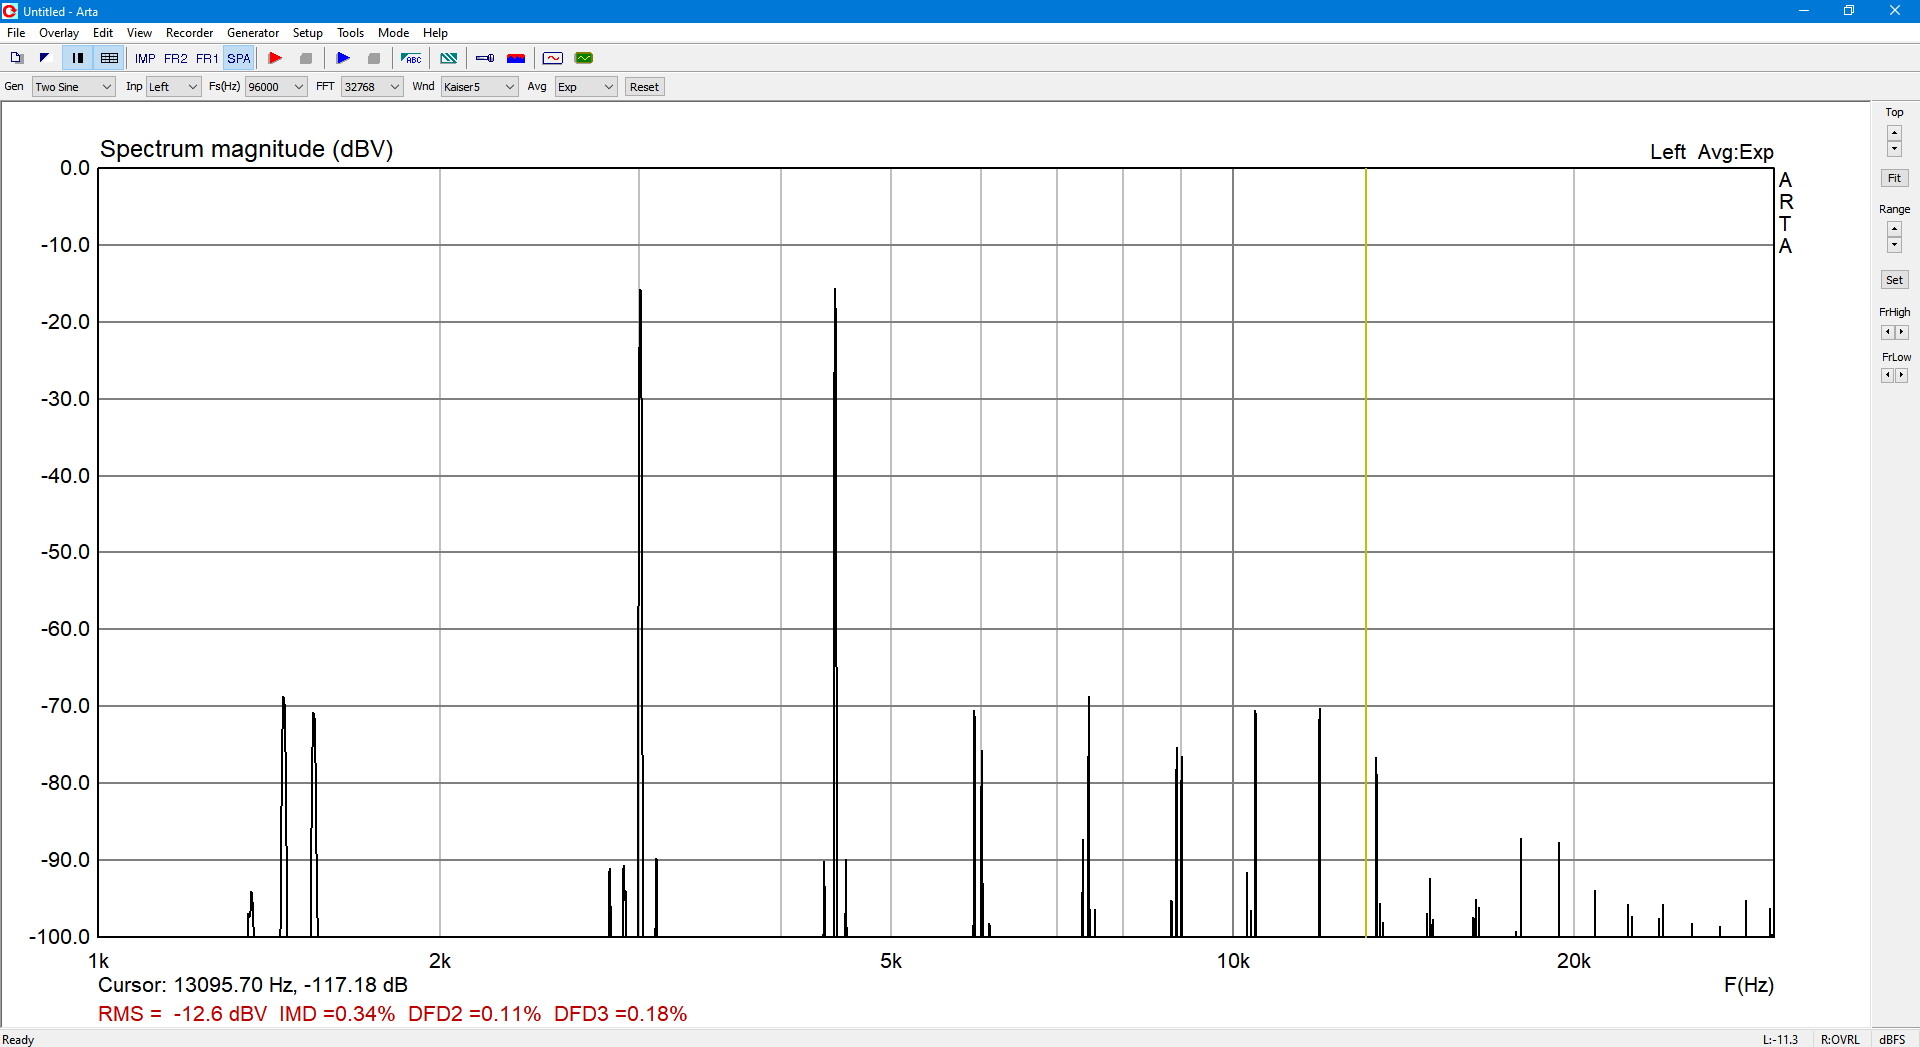
b) REW
c) ARTA IMD = 0,22% = -52,8 dB
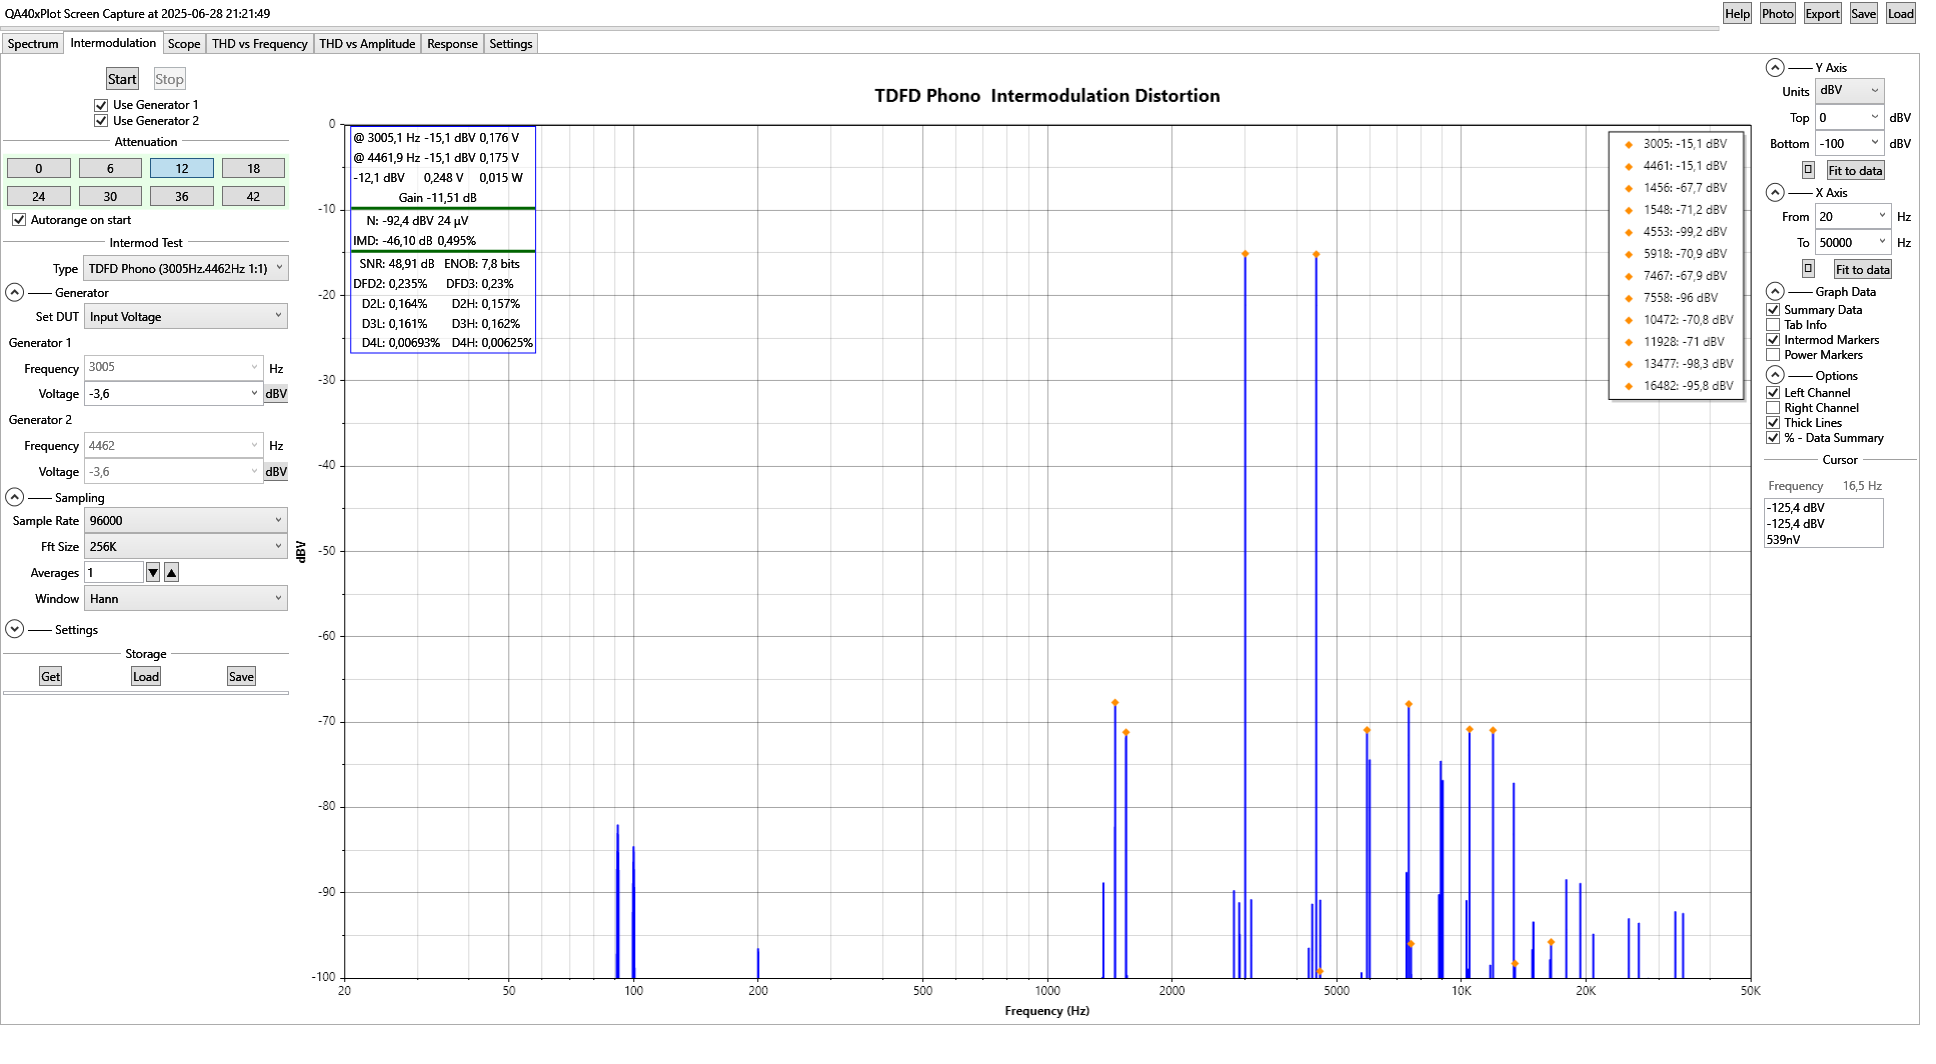
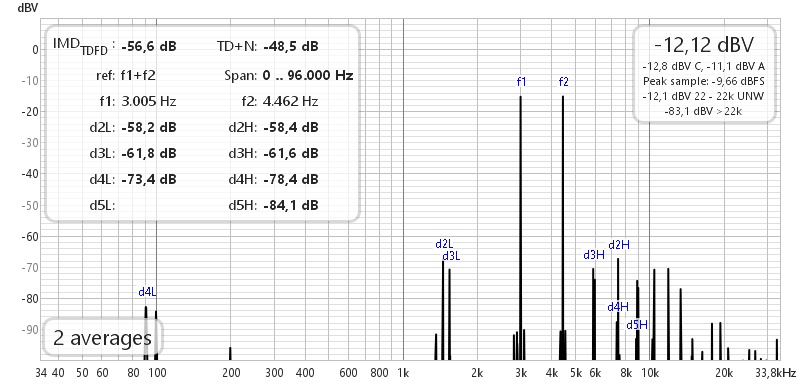
6. TDFD phono 3005 Hz + 4462 Hz 1:1
QA40xPlot and REW are by 11 dB apart.
ARTA, using the CCIF method, is 3 dB from QA40xPlot.
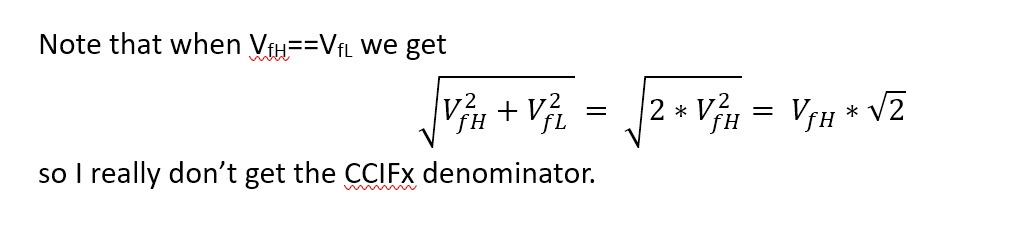
If I do the math manually according to the formula quoted above in REW, but with the arithmetic sum for f1 and f2 in the denominator rather than the rms sum, I arrive for the QA40xPlot data at -57 dB, same as reported by REW. Seems to me that the formula in this case applied by REW is
IMD(TDFD phono) = sqrt [V(f2-f1)^2 + V(2f1-f2)^2] / (V(f1) + V(f2))
(like CCIF) and not the one I assumed above with the rms sum in the denominator.
Like wise, the math with the data from ARTA arrives at -58 dB then.
a) QA40xPlot
b) REW
c) ARTA IMD = 0,34 % = -49 dB
Regards
Reinhard