Question regarding measuring filterless class D amp

I’m just getting started using the QA403. After getting some pretty bad (multi-%) intermodulation results measuring a tube amp that otherwise seems not so bad, I thought I measure my ‘good amp’ for reference, a Loxjie A30 based on the Infineon Merus MA12070. Surprise, surprise, distortion & IM are even worse! QA403 loopback numbers look ok. After extensive head scratching, I found @matt’s blog post First Look: Infineon MERUS MA12070 – QuantAsylum where he points out that apparently one can’t just terminate a filterless Class D amp into a power resistor and expect good results. So, I have a few 22 microHenry 3 Ampere inductors on order that I’m planning to put into series with the 8 Ohm load, but I thought I’d ask here whether anything else (e.g. additional external filters) is needed. Is the measurement pretty straightforward after adding the inductors? I would like to look at harmonics over the whole audio frequency range; do I need to introduce an artificial cutoff somewhere just above 20 kHz for the class D amp (which would severely limit the accessible harmonics range, but should be ok for intermodulation measurements)?

Looking for example at Effect of measuring bandwidth on class D amplifier measured THD and THD+N parameters | Audio Science Review (ASR) Forum , it seems I might NOT need to limit bandwidth just above 20kHz?

Hi Gruesome, I am measuring class-D amplifiers every day.|

It is quite ok to measure these amplifiers with QA403 but you need to do some steps.

  1. most of the class-D amplifiers are BTL and have a DC midtap voltage. First you need to transfer the signal from BTL to single ended.

  2. Next to this you need to filter the signal with a sharp Low pass filter to filter out the PWM residual signals and to avoid aliasing effects just due to the digital sampling of the tester.

A simple trick to do differential to single ended conversion is to make use of an small (old style) radio transformer which works linear from 20Hz to 20kHz or byond. Then add a first order low pass filter.

Myself, I created an 5th order measurement filter with differential to single ended conversion and high common mode rejection for DC since the amplifiers need to measure also have a folllowing boost supply.

JP, thanks.

Stupid question: why can’t I connect the bridge tied load directly to the + and - inputs of the QA403? (Assuming I respect the AC and DC input voltage limits.)

Have you run into a problem with filterless class D that needed series inductors, or is in your experience everything solved with that PWM filter (which needs to suppress the multi-100kHz switching frequency, so doesn’t need to sit right above the audio bandwidth, if I understand correctly)?

In principle you can directly connect to the + and - input but the PWM outputs have large switching signals. In this of using + and - input, you also need to have 2 x low pass filter with same transfer and common mode isolation. Small deviations means error signals.

Alternative a good differential measurement filter can be used but then there can be still large input signsals on QA403. Think about BD modulation, with small audio modulation both PWM outputs of the BTL amnp have same switching signals. So the differential filter will normally not block this and if you want to measure small audio signals with large PWM level switching the QA403 inputs need to handle the large switching signals, so large attenuation is needed by the input attenuators of the QA403.

Better is to first go back to the GND domain and get rid of the common mode switching signals. This can be done with the cheapest solution to make use of an audio transformer to make it single ended followed by a low pass filter. Then you can also show the audio signal directly on a scope.

All the class-D, I measure nowadays is filterless with analog or digital I2S inputs. Long time ago we developed single ended high power class-D chips like TDA8920 and these required LC output filters.

At my present company we only have filterless class-D with powers 1W to 30W. I can measure these well with the active filter module I made and als with the simple transformer trick. This active filter has more then 60dB supression of the PWM frequency at 384kHz. I can measure easily THD levels downto -90dB with this in an measurment bandwidth of 20kHz.

My measurement results with QA403 is close to the results we measure at the office using APX500.

For your info, I use simple dummy loads which is an R+L to represent a speaker.

Thanks again, JP, for the detailed explanation! I now started reading a TI note from 2008 on class-D filter design (https://e2e.ti.com/cfs-file/__key/communityserver-discussions-components-files/6/Class_2D00_D-LC-Filter-Design.pdf), and I have to take back what I carelessly said earlier (that ‘I like measuring’ - maybe on a different forum) :wink: .

I think I have to read up a bit on filterless class D, and maybe also open the box (Loxjie A30) and see what if any filter components are inside. I was really hoping it would be as easy as soldering up some banana plug extender cables with inductors, plug in and measure. Apparently not so.

I do have a cheap 1:1 in-line audio transformer (originally bought to couple that same BTL amp to a Focusrite soundcard, so same purpose really), but I was/am (naively) thinking that the transformer characteristics would be worse than the amplifier characteristics, so that I would end up measuring the transformer, not the amp. Ok, time to start soldering.

Succes with the soldering.

Later I will dig up the schematic of my active filter and share it.
If you have a good differential probe that can be also a good starting point. The output of the differential probe needs to pass a low pass filter and then could be used.

Hi Gruesome,

Here some links on AUX0025 filter used with APX. It is a sharp filter with passband as flat as possible in audio band.

Spec: https://www.testequipmenthq.com/datasheets/AUDIO%20PRECISION-AUX0025-Datasheet.pdf

Schematic: Aux0025 Schematic | PDF

BR JP

Very interesting. On the one hand the AP filter looks quite involved, on the other hand that’s maybe not surprising given that it needs to be flat to ± 0.05 dB. Good thing I only bought/build simple class A amps after the Loxjie. I thought I had measured the Loxjie (the amp with the MA12070 chip) in the past, because that’s what I had bought that little 1:1 audio transformer for. I also distinctly remember putting a voltage divider in there, to measure the amp at higher power. But I must have failed. All I can find in my notes and REW files from 2023 is headphone output measurements (in all likelihood not using the MA12070 - I opened the amp, but did not trace out the headphone connection; also: no filtering I can see for the speaker output), which look fine. I should have taken better notes, especially of the failed measurements….

If I simply hook up a real speaker as load, will that damp the HF content enough for an electric measurement? I know, I should just try it, but I’m more than a bit wary to make my hearing worse; I think the acoustic sweeps I did in 2023 induced a slight tinnitus.

Simply putting the 20 microHenry inductors in line between the A30 speaker output jacks and the 8 Ohm load does not solve the problem.

I built a bunch of adapters to put the 1:1 audio transformer I have between the A30 speaker output and the 8 Ohm load. Most likely my transformer is just the wrong type; I believe it’s made for line level ground separation, not for Watt-level power. I’m measuring DC resistances of 490 Ohm and about 390 Ohm for the primary and secondary coils, respectively.

Looking at the A30 output signals with a ‘real’ scope (also a USB plugin ), it becomes clear what the problem is: the A30 output has huge 60Hz common mode noise in the output; I’m seeing peaks of +18V and -10V. When I use the QA403 generator to send a 100mV signal into the A30, it does show up in the channel difference, but there is still a large common mode component that makes it through into the difference. (This could be either real, or due to insufficient common mode rejection of my ‘Analog Discovery’ USB scope.)

When I then look at the A30 output through the 1:1 transformer, the overall gain is smaller than one, and the common mode noise is still there. At this point I should probably look into what my scope thinks the reference ground is, but for now I’m just happy that I haven’t destroyed any of the gizmos (QA403, Analog Discovery scope, A30) in the course of my measurement adventures.

A few pics from my notes:

  • USB scope

    • No signal on A30 input; both outputs have +18V/-10V common mode 60 Hz noise!

    • With 10mVrms 1kHz input from QA403 (A30 vol 34)

With transformer, 100 mV 1 kHz input, vol 60:

In addition to all this, as suspected the transformer itself measures worse than what I’m hoping/expecting for the MA12070 amplifier:

I guess in hindsight it’s pretty obvious that that line-level mW-power transformer has to go downstream of the (8 Ohm) load resistor, and doesn’t do RF filtering as much as just allowing translation to a single ended input into the QA403, taking out the common mode noise. Which is what JP had said. And maybe the 20 microHenry inductors are already doing their job.

Back to more adapter soldering…

Hi Gruesome,

I hope you.do not connect the load after the 1:1 transformeer right? The 1;1 transformer with low pass filter is only for the QA403

Oh yes, initially I hooked it up the wrong way around. Now it seems to be working, but the transformer sets the distortion floor, I believe. So, not really the measurement I intended to do.

This is what I get when I tell the QA403 to aim for 1W output power into 8 Ohm:

Grounding the QA403, grounding the load sense cable shields, and running the tablet & QA403 on battery power do not make any significant difference.

The inductors do contribute significant distortion above 200Hz. Here are graphs at 100mV input and full A30 gain, with (full lines) and without (dashed lines) the inductors.

What I really was/am interested in is not only the overall THD, but the behaviour of the higher harmonics out of this amp, when compared to my other amps with larger overall THD, tube amps and single or two-stage MOSFET and VFET amps. But the transformer already shows H3 dominating THD, and H5 getting larger than H2 above 1kHz, so it’s difficult to draw any conclusions regarding the class D A30 with this measurement setup.

Could one use a measurement of the transformer only in the right channel as a reference? I see for example that H6 and higher harmonics (called D6+ in the graph) are significantly higher with the amplifier in the loop.

Also, in the middle of the long ASR Loxjie A30 review thread I found somebody inspecting disassembly pictures and stating that they identified ferrites (SMD, I assume) right near the MA12070 chip on the PCB. They suspect there are LC filters integrated in the speaker output circuitry. So my additional inductors are probably not necessary.

Jan-Paul @JP-Huijser, Matt @matt , and anybody else knowledgeable, I would appreciate your input into whether the approach described below makes any sense, or what I might be overlooking.

What I’m thinking of doing is using the harmonic visualizer to extract the harmonic amplitudes at discrete frequencies, and then subtract the reference channel amplitudes to arrive at the amplifier contribution. Is there something fundamentally (or subtly) wrong with this approach?

I looped the second channel of my small audio transformer into the QA403 right channel single ended loopback reference setup, and dialed in the gain of the amplifier in the left channel loop so that both channels see about a gain of 1 and read the same signal amplitude at 1kHz and 100 mV QA403 generator output (and, within errors, at all test frequencies from 100 Hz to 8 kHz.)

Here is an example of the output at 8 kHz; left channel (yellow) is QA403 single ended output feeding the amplifier, speaker output into 8 Ohm, and then through one channel of the small audio transformer single-ended into the QA403. The right channel is QA403 single ended - other transformer channel - single ended into QA403. There is no additional low pass filter in the loops.

So I’d take the amplifier contribution as the difference between the blue and red amplitudes, which in this case is easy, because the blue ones are so much larger (e.g. -67.4 dBc - 91.5dBc = -67.96dBc, so pretty much the same as the first number).

Up to 1 kHz there is hardly any difference at all, and at 5 kHz there is some. I defined, or tried to define, the measurement bandwidth to go up to 48 kHz, I ran the QA403 at 192kHz, so at 5kHz H9 should still be in the band, and at 8kHz H6, if the 48 kHz limit is really applied. I note that the visualizer bar graph quotes higher harmonics than H6 at 8 kHz, but maybe the bandwidth setting only affects the THD sum, or maybe only the noise integration. Which is why I tagged @matt .

Does any of this makes sense, or is the approach invalid, for example because too much switching energy is leaking or is aliased into these (seemingly sharp, though) harmonic lines? (I know I can’t measure the noise this way, evident from the yellow spectrum rising from 20 kHz to 100 kHz.)

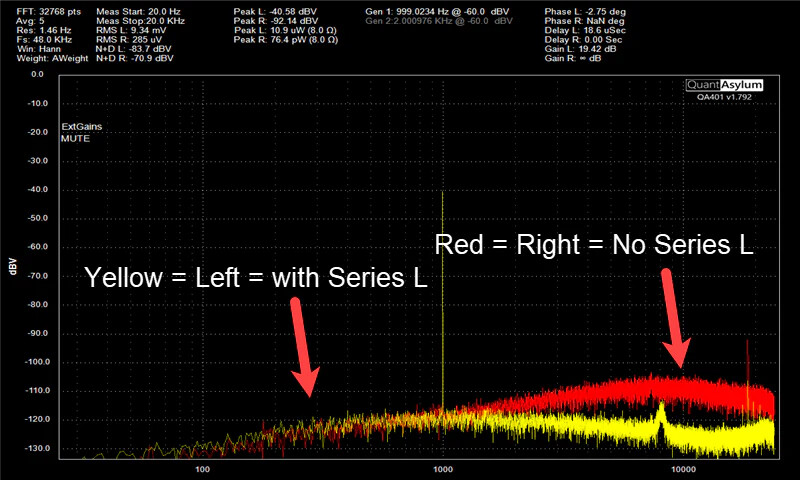
I inadvertently ran the same measurement series (100Hz to 8kHz) with the 20 microHenry inductors in place, and interestingly the inductors seem to mostly increase the lower harmonics H2 and especially H3, and decrease the higher ones:

Puzzling, or maybe a lucky coincidence, is that the THD numbers (sums? How are they computed?) are almost the same with and without inductors, even though the individual harmonic amplitudes are quite different.

H2 +11, H3 +28(!), H4 ~same, H5 +9, H6 -8(!), H7 ~same, H8 -8, H9 -7, H10 (80kHz) -6.

Probably not, but it seems a lot of math will be needed to get a measurement. At the core, you seem to have a lot of 60 Hz that is confounding things. In the post you linked HERE the measurement was made using a QA450. Note the QA450 had no additional filtering, it was just load resistors.

And so, Infineon indicated you could make good measurements with the 22uH inductors in series with output, and I also confirmed.

As a first step, you can try to make a plot as follows to verify the noise (this came from the post linked above). And build up slowly. That is, if you cannot replicate the noise measurement, then the more advanced measurements will be off too.

Now, take a look at your plot above, reproduced here:

There is a clue in there with the 9 kHz tone. That seems to be an artifact from the Merus design as it’s present on both my measurement (at around -115) and your measurement (at around -70). Note that proximity in the setup will change measurements a lot. I’d say to go back to looking at amp output noise by itself, and try to see how the proximity of nearby devices can change measurements. Explore grounding options to get the 60 Hz down. Remember, you are trying to measure microvolts…something that has extremely fast edges (class D silicon) is operating nearby and can exhibited radiated coupling into nearby measurements and contaminate them. That’s why you should start with noise measurements and get those nailed before moving in. In my case, the Infineon spec said you could nominally achieved 60 uVrms of noise (20K, A-weighted) and I demonstrated 63uV with the inductors.

I’ll look to see if I can find the Infineon board and inductors at the warehouse and replicate with QA403.

Have you measured the transfer of your little audio transformer (gain over frequency)?

Thanks, @matt ! I should start with noise, and I actually thought about properly grounding the A30 amplifier chassis. Clearly there should not be full rail amplitude 60Hz on the output! I was just anxious to see whether there is a possible strategy at all to get at the higher harmonics.

Unless I’m misunderstanding you, the 9 kHz you are referring to are actually the injected 8 kHz signal in my plot. I do not see a 9 kHz peak.

@JP-Huijser , thanks for chiming in again! You guys are really super helpful. Yes, I posted the transformer transfer curve earlier. In addition, it is in the reference loop in the second QA403 measurement channel, so any deficiencies should show up in the red curve and numbers. From the earlier plot pasted below, transformer gain is flat, and THD falls 20 dB per decade, and is about -68dB at 1kHz.

Hi Gruesome, Matt,

I understand that there are basically 3 things discussed here:

  1. the A30 amp you are measuring has large 60Hz common signal

  2. see the THD and harmonic spectrum with 8kHz tone

  3. Matt has seen a 9kHz spurse tone when testing the MA12070.

Reading through the datasheet of the MA10270 I read that this chip uses a 4th order feedback system which is tricky in my opinion for stability. So when Matt was refering to a 9kHz spourse this might have been related to some oscillation.

We developed our amplifier chips in the past using a 2nd order or 3th order feedback system. Normally with fpwm=300kHz the loopgain of the feedback system needs to have a GBW (cross 0dB open loop) roughly at fpwm/3. Noticed for MA12070 that fpwm=600kHz or 300kHz depending on mode of operation. This means that for tones of f.e 6kHz the 3th harmonic at 18kHz can be already quite large due to limited gain headroom at a closed loop gain of 20dB. This can be clearly seen in the specification of the MA12070. They measure thee THD=freq graph and avove 6kHz (3th harmonic is close to measurement bandwith used of APX550 and AES17 (20kHz) brickwall filter. As such above 6kHz you see in the measured graphs a steep lower THD level as all the harmonics dissapear.

So related to item 2: above 8kHz you can expect large 3th harmonic, 6th harmic tones due to limited open loopgain. Also the mode switching in the MA12070 most probably will introduce juming levels of the harminics.

Related item 1: with 19.4dB gain of the MA12070 seeing such a huge common mode tone 0f 60Hz is strange. Suggest to check if there are ground loops picking up the noise.

To improve THD at larger frequency signals in general a larger GBW is needed and as such a higher pwm frequency is needed. As such lowest THD numbers are epxected with the operating mode of the MA12070 with fpwm fixed at 600kHz.

This is my take on this.

Thanks for the detailed thoughts, J-P! I feel like I am getting a bit better understanding of class D amps just from reading what you write. From the gist of your last post, it is not completely crazy to suspect that higher harmonics could creep up for a class D amp, depending on gain-bandwidth product, the feedback filtering(?), and the closed loop gain one is actually running at.

The 60Hz noise was user error, I’m afraid. By plugging in the shielded but not grounded BNC leads I had made for the 8 Ohm load resistor, the AD2 (Analog Discovery 2 USB scope) was free to bounce around 40 V peak-to-peak. The noise even appeared with the A30 amplifier turned off, and when probing a protective earth ground.

So now I’m back to looking at the A30 output with the AD2 scope. I do not see a well defined switching frequency with the input to the A30 terminated; I guess it could be that the amplifier (or the MA12070 chip itself) turns the amplifier chip off when no input signal is present.

Hi Gruesome,

Thanks for your feedback. Good to hear that the 60Hz was solved. When testing BTL amplifiers with a scope you need to use either 2 channels and substract function in scope, or use a differential scopoe, or use the transformer scheme I showed earlier, or use an active differential to Single ended ac tive filter scheme (like I use to test class-D amplifiers).

When the amplifier uses BD modulation then with no signal driving, the differential signal will contain no PWM signal. Only looking to 1 BTL output pin you can see switchiong but bot B TL outputs swtich at same paste, thus differential you can see nothing. Only when sjgnal appears you can see 2xPWM freqeuency signal.

Nowadays also 1.5 bit DAC is becoming popular to be used in class-D amplifiers.

Suggest you to google BD-modulation or 1.5bit DAC.