Speaker Impedance with QA403 + QA461

It is not as simple as you hope. In measuring a loudspeaker you have a system that is both mechanical and electrical with a dash of magnetic dampening thrown in for kicks and giggles. Reactance in the magnetic circuit if you have shorting rings. The reality is that for the mechanical system to get up to speed and settle it takes time. Don’t believe that the mechanical system changes your resistance measurement? Leave some loose change in the cone and watch what you measurement looks like.

I left behind a sweep system ten years ago. If there is a way to do a stepped sign wave I would love to try it versus the sweep. My programming stopped in 1986. So it is a little rusty.

Mark

Hi @Kravchenko_Audio, yes, very fair points. Will study more

PS. I wonder if it would make sense to sweep, and then have an option to use a tone at the key freqs (f1, f2, fs, zmin, f3, etc) and plot those as points on the sweep. Maybe that is a useful place to start…

Blockquote Hi @Kravchenko_Audio, yes, very fair points. Will study more

Do you want a screen recording of the method that the Speakertester Pro uses? The entire stepped sine wave sweep you do not need. But the searching for zero phase crossing is informative enough, and is rather quick.

As a simple thought. When we calibrate on the Speakertester Pro, we can calibrate on the test impedance of the test leads at the tester, or at the test leads terminals. I understand that we are making an independent DCR measurement. And this is a good idea. But are you incorporating the test lead resistance from the QA461 in any way in your calculations? Could you for example incorporate the test lead resistance if we measure the lead resistance? And have a place to enter it?

Another thought. What is going on with the inductance calculation?

Inductance from the leads if they are discrete should be negligble. If it is a paired wire it would be a small source of inductance error.

Mark

Blockquote PS. I wonder if it would make sense to sweep, and then have an option to use a tone at the key freqs (f1, f2, fs, zmin, f3, etc) and plot those as points on the sweep. Maybe that is a useful place to start…

That may enable a greater degree of accuracy, my guess is that you will need to do a mini stepped sine seep at these points as the stepped sine sweep will uncover discrepancies.

There is nothing wrong with innovation right! Especially when it works!

Mark

Any progress?

I have been rather busy with a few drivers that I am nursing through different stages of design and prototyping.

Mark

Hi @Kravchenko_Audio, I spent a few hours last week looking at benefits of stepped sine. I think there are two tests you could try to replicate:

First, look at swept output results using a short FFT versus long FFT. In the plot below, you can see an 8" speaker test. There were two sweeps: A 32K FFT (32k/48k=666 mS) and a 1M FFT (1M/48k=22 seconds). If the mechanical response interacting with the sweep was a sizable contributor, then we’d see some kind of difference when you had a 33X difference in sweep speed. But you don’t see much of a difference at all. You see a bit more noise, but this comes from the reduced energy associated with the 666 mS sweep.

Next, note on the plot above I show the zero phase frequency. At 33.92 Hz, the phase is 0.132 degrees–effectively zero. Since the phase is zero, we can treat the speaker as a resistor and do the complex math using just a calculator.

So, set a sine for 33.92 Hz (disable “round to eliminate leakage”). And measure voltage and current. I’m using the QA461 with the -20 dB output monitor, so the 31.12mV across the speaker is actually 311.2mV. And the current monitor is 1 ohm (effective) and that’s showing 8.529 mA. So, if the phase is zero at this point, that suggests 36.48 ohms

Now, let’s check back to the swept plots with some lines added. Here, we can see at zero phase (33.92 Hz) the impedance is around 39 ohms.

OK, now let’s look using the oscilloscope visualizer. In the next release, the scope will allow you to display phase:

And here we can see the phase isn’t zero: It’s about 14 degrees. Interesting. So, our math above isn’t quite correct.

OK, so now I step the sine freq 0.25 Hz at a time, and adjust to get close to 0 degrees. This frequency is 31.90 Hz.

And now I go back in and compute impedance and I get 311.2/8.10 = 38.41 ohms. This agrees much better with the sweep. But the frequency isn’t quite the same.

So, speed of sweep didn’t have much of an impact. However, manually hunting for zero phase with a sine yielded zero phase at 31.3 Hz and Z of 38.41 ohms. Sweep yielded 33.92 Hz and 39 ohms. So, the Z is very close (1.5%), but there’s a discrepancy (31.3 Hz versus 33.92 = 8.3%) in Fs.

This might be a an interesting test to help evaluate issues are seeing. What do you think?

Well, I have some testing to do. I’ll try this and report back.
I know that getting the zero crossing on my current setup does take a little bit of time. So this may be a key to a more accurate set of basic parameters to build the rest of the calculations on.

Have you figured out why your Inductance and Bl is so far off?

Mark

Hi @Kravchenko_Audio, any shift in time will result in a reactive contribution to a measurement. When measuring a resistor, you can look at the delay between the left and right channels and see a delay that is setup dependent. For example, with the QA403 and QA461, I see about a 4.5uS delay between the channels with driving a resistive load. Probably there will need to be a global calibration routine to get setup dependent delays zero’d out.

But, back to the issue at hand. When validating, the key point for all testing is this:

  1. First, test with a resistor to verify your setup. You should be able to set the frequency to just about anything (pick 1 kHz or 50 Hz), and measure the voltage across the load with a DVM and then across the sense resistor, and then calculate Z manually. And then repeat on the QA403 using a tone. And then repeat again using swept sine.

  2. Next, repeat that experiment using the complex load (speaker) measured at the point of resonance. As you know, at resonance the phase is zero, and so you can manually measure with a DVM and confirm everything as with a resistor. This should allow you to compare Zmax across platforms. Remember that Fs and Zmax are drive level independent, so you need to verify drive levels are comparable.

  3. With resonance determined, the next point to verify is Qms. The report for the speaker impedance test shows the formulas.

  4. And with Qms verified, the next parameter to verify is Qes, and then Qts.

As you know, drive level impacts Fs. The harder you drive, the more Fs drops. With DATS V2, it seems to drive around -14 dBV. That is, when I set the QA461 drive to -14 dBV, the Fs agrees with DATS V2.

Thus far, I’m able to verify with a Parts Express DC200-8 speaker on SW 1.194 (not yet released):

Platform Fs (Hz) Qms Qes Qts L @ 1 kHz (mH)
DATS V2 32.97 2.593 0.4988 0.4184 2.692
QA40x 32.96 2.7679 0.5822 0.4810 2.767

Now, even though the Fs is adjusted (using drive level) to be identical, we can see the Qms diverges by almost 7%. The Zmax on DATS looks to be 43 ohms, while on the QA403 (confirmed with DVM and tones) is 39.42. And that right there is a 9% divergence. If the Zmax can’t be agreed upon, then nothing else (Qms, Qes, Qts) will be agreed upon. But at least Zmax can be readily checked for accuracy with a DVM.

Of the pro loudspeaker manufacturers who still provide impedance curves, -sadly, too few- Most use a log magnitude scale from 1 to 100 Ohms. I believe it may be established by a standard but I don’t know which one or by whom. Would it be too big of an ask to have that option available? It would make comparison with the printed spec sheet much easier.

Thanks,

Dale Shirk

Ok I will type and prove that I am a buffoon. I cannot for the life of me get a resistance test to work on my setup. I made up a precision 10 ohm power resistor years ago after burning out the 10 ohm Caddock supplied with my Speakertester Pro. it is 10.04 ohms. So I connect it to the 403. Wire up as per the app note and I get nothing useable. Behold!

The wiring is exactly as shown in the App note. What is going on Master Matt?

Mark
Slightly confused and bewildered

Mark, the USB voltage is too low…

Hey!

Something looks wrong with the right channel, it’s basically measuring nothing (the red line). So is it connected like this, is that cable dodgy?

You should have have no problem measuring the -40dB expected signal on that channel.

Does the QA461 have power?

Sorry, not much help!

Yes Claudio. It always has been under 5 volts. Do you think that this is the cause?

Hey there Dan. Fair point. I can get a decent reading when testing a driver, so my guess is that this wire is fine.

No mosquitoes were harmed ( on purpose :slight_smile: )

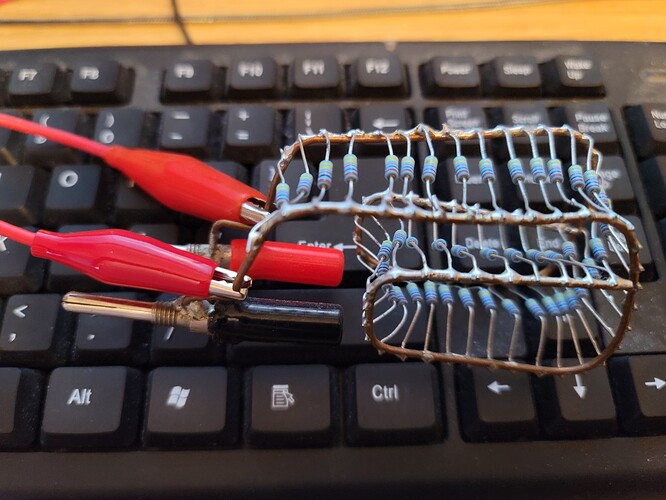
Yup it’s not as pretty as it used to be. But it is a rock solid 10.04 ohms. Non-inductive to boot.

I think it’s not connected correctly. I think only the + output of the QA461 is used.

Now that is some fine engineering!

1 Like

Thanks Dan
That may very well be. Looking at the App note pic that you also posted I used the positive output of the 461 on one side of the resister, and the centre pin of the + input of the 403. Is this incorrect? Like I said, I am most likely the problem.

Mark

Hello
The load/DUT needs to be connected between the + and - output of the QA461. The “Output Current Sense” output goes to the QA40x “+ Input”.
This should work for any type of low impedance load.
Good luck

1 Like

Hello AVO

Pardon my ignorance. But I am following this connection.

So you are suggesting that I remove the Shorting plug on the 403 for the Left negative input and connect the test lead to the second side of the resister that currently I have connected to the + output of the 461.

Mark

If the red wires represent single conductors, of course you’ll get the result you did. As is, the DUT is in series with the 100K Ohm analyzer input. You’re not actually driving any current through the DUT.

Your photo shows a red and black wire out of the 461 output. They should go to either side of the DUT. An additional wire from the red +side of the output should go to the L+ preferably from right at the DUT. Optionally the -side of the DUT could also go to the analyzer L- which would account for conductor loss

Dale

1 Like